
Work from Home and the Challenges Facing America's Big Cities
EXECUTIVE SUMMARY
EVER SINCE THE ARRIVAL OF THE COVID-19 PANDEMIC in the US in 2020 led to a surge in people working from home (WFH), cities across the country have been forced to reckon with the possibility of a “Doom Loop” scenario of vacant offices, depleted central business districts, declining economic competitiveness, and fiscal stress. However, given the right set of policies, cities can reverse their fortunes and embark upon a path to a “Boom Loop” of greater productivity and economic growth.
In this paper we examine the possible paths ahead for New York and four other large, geographically, and economically diverse cities: Chicago, Miami, Philadelphia, and San Francisco. The WFH share of the workforce in New York, the nation’s most populous city, jumped from 4.8 percent in 2019, the year before the arrival of the pandemic in the US, to 16.2 percent in 2022 as COVID was subsiding. This increase reshaped the economic landscape of New York and resulted in declining in-person business activities that affected sectors including housing, commercial real estate, labor, and transportation.
As activities in the urban core have shrunk, so might returns from urban agglomeration— the geographical colocation of employees and companies that generate productivity benefits for these firms. If New York were to be affected by such a Doom Loop, the estimated direct loss in economic returns from urban agglomeration could amount to $17.2 billion annually. While such a loss would not itself be that large relative to the city’s 2022 gross domestic product (GDP) of $1.2 trillion, the additional indirect fiscal losses could be significant if people and firms continue to choose lower-cost locations outside New York’s tax boundaries in response to the declining urban productivity advantages. Agglomeration declines can spur responses in which budget shortfalls lead to shrinking public services and higher taxes, which in turn lead to cycles of decline like those that occurred in the 1960s and 1970s in many US cities.
By contrast, remote work presents opportunities for New York and other cities to enter a Boom Loop. As the pace of technological change accelerates, cities like New York could realize significant gains by leveraging the lower costs of WFH for some tasks, intensifying the innovation of in-person work, and increasing spheres of influence via both WFH and modernized transportation networks that enable easier physical access. This opportunity is only likely to grow with the explosion in generative artificial intelligence.
This analysis concludes with specific policy recommendations for avoiding Doom Loop outcomes in New York, along with analyses of the impact of WFH in the four other cities listed above.
We argue that New York City should consider the following policies to navigate challenges and opportunities associated with WFH. Many of these recommendations apply to other cities as well. The policies include:
• Promoting the city as the home of innovation-generating sectors that traditionally benefit from in-person interaction;
• Leveraging the employment of remote workers for tasks that do not require physical presence or agglomeration, thus optimizing operational efficiency and lowering both commuting and real estate costs;
• Ensuring that the municipal tax system encourages in-person work;
• Adapting public and private infrastructure, including mass transit, to thrive in an environment that increasingly requires flexibility;
• Building more amenities to attract residents; and
• Lowering the price of housing by increasing allowable density under zoning regulations and reducing production costs (including construction and regulatory costs) and the time required for permits and land-use reviews.
INTRODUCTION
THE FISCAL FORTUNES OF CITIES are inextricably linked to their economic performance. After the COVID-19 pandemic partially shuttered the US economy in 2020 and forced millions to flee their urban offices and work from home, the persistence of remote employment has challenged the competitive position of city economies and threatened tax and fee revenues from previously reliable sources. To avoid a Doom Loop1 scenario of continued decline and set themselves on a path toward a Boom Loop recovery, cities need to sustain competitive advantages. To do so, they need to adopt economic and fiscal policies to address the evolving changes in the workplace involving the decoupling of work and residential locations. Factors affecting the productivity of in-person work and the quality of life in communities large and small will be crucial determinants of the city’s success. Big cities—such as New York, the nation’s largest—are particularly vulnerable to remote work as they suffer the longest commutes. But these cities have benefited from job growth in the technology and financial services sectors in the past—and they can again.
WFH dramatically increased the use of remote work technologies like Microsoft Teams and Zoom. This shift is likely to be a lasting outcome of the pandemic, which fostered the acceptance of remote jobs and flexible hours while propelling the advancement of platforms and services supporting new patterns of work. WFH Research’s monthly online US Survey of Working Arrangements and Attitudes shows that before the pandemic, employees on average worked less than 5 percent of their annual workdays from home. By May 2020, however, fully paid WFH days had risen to a high of 61.5 percent.2 While the percentage of fully paid working days had fallen to 37.0 percent by December 2020 as the pandemic ebbed, subsequent declines have been less dramatic: WFH reached 33 percent by December 2021, 29.3 percent by December 2022, and 28.6 percent by November 2023.3 Hybrid work has played an important role in this societal change: as of 2023, 12.7 percent of full-time workers were fully remote, while 28.2 percent worked on a hybrid schedule.4
The slow decline in the proportion of days worked remotely suggests that WFH, either fully remote or hybrid, will endure as a significant feature of the American workplace. This presents challenges for cities. Fewer workers and businesses in city centers mean higher vacancy rates across lower-tier office buildings, less retail activity—especially among smaller businesses serving neighborhood workers—and a shrunken tax base. Fewer riders on mass transit may undermine public funding support for transit systems and force agencies to defer needed maintenance and cancel capital investments. And as WFH becomes more commonplace, residents may increasingly move away from urban centers to more affordable areas, and firms may follow. Firms that adopt the new technologies may be less reliant on agglomerations and they may relocate to more affordable areas to avoid the high costs of living and of real estate associated with large agglomerations.
Collectively, WFH’s potential impacts could undermine what are known as urban agglomeration economies: the forces that lead to the colocation in densely populated cities of employees and companies across various industries. The benefits of urban agglomeration economies include greater opportunities for exchange of ideas and knowledge sharing, flexible labor markets, and more efficient supply chains.5 A reduction in these benefits erodes the economic and fiscal health of cities.
WFH also offers advantages, however. Because WFH will mean jobholders travel to company offices less frequently, they may find a longer commute more tolerable, potentially increasing the geographical area from which cities draw workers. Firms can concentrate on jobs benefiting from in-person interaction where urban agglomeration economies are robust and use remote workers in less expensive locations—domestically and abroad—in positions well suited to WFH, thereby lowering their labor costs and increasing their productivity. Remote work may also help address housing affordability, as residents move to less densely populated areas and free up homes in city centers. Finally, WFH could alleviate congestion during peak commuting times, relieving some public infrastructure constraints. Cities can respond strategically to these challenges and opportunities.
Though cities face economic and fiscal hurdles in the near term, they have had only a short time to adapt to WFH. We should therefore be cautious in drawing conclusions from current conditions and recent trends, which reflect the beginning of an adjustment period rather than a stable state. Indeed, many predictions have been made in the past about the decline of cities. Such predictions have proved true in some cities, while others that were forecast to fail have instead flourished. New York City is a prime example of this resilience. After its fiscal crisis and near-bankruptcy in 1975, the city faced a significant financial shortfall, a sharp decline in public services, rising crime rates, and deteriorating infrastructure. Despite these seemingly insurmountable challenges, the city adapted and entered a dynamic era of prosperity.
Ultimately, cities’ fiscal health depends on their economic activity and the tax revenue it generates. This paper examines the challenges of WFH and potential adaptation strategies for New York, Chicago, Miami, Philadelphia, and San Francisco in real estate, labor, transportation, industry structure, and the geographic distribution of economic activity. 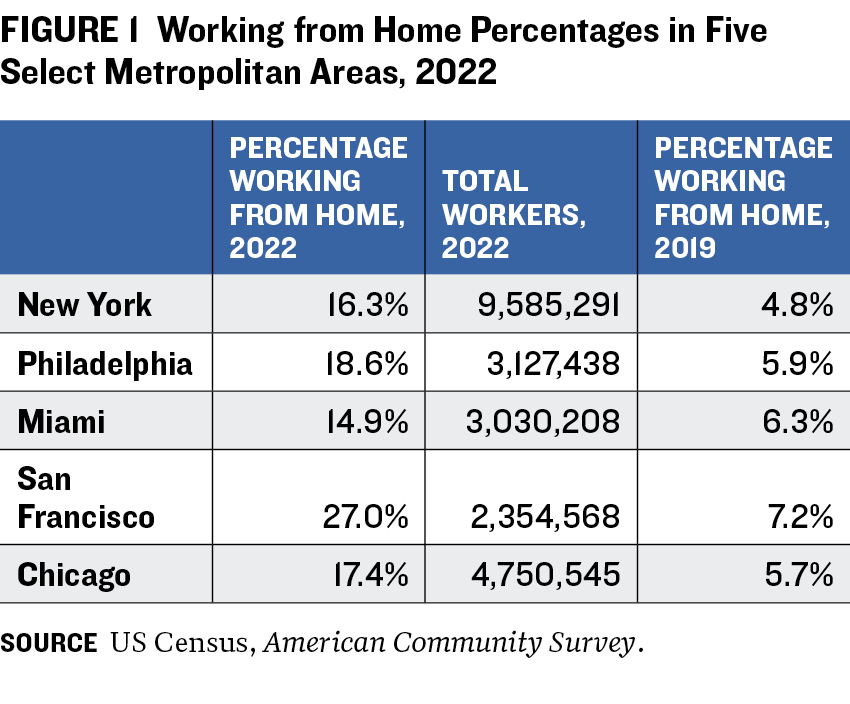
The long-term fiscal implications of WFH are explored in three possible scenarios in which cities reach a stable state: Doom Loop Prevails (cities’ competitiveness is permanently lower); Recovery (cities fully return to prepandemic levels of economic activity); and Virtuous Boom Loop Arises (cities prosper over the long run as economic activity increases).
As figure 1 illustrates, there are significant differences in WFH levels across the five cities considered in this paper. New York experienced a major increase—nearly 12 percentage points—between 2019 and 2022. San Francisco had the highest WFH percentage among the five cities in 2022—it rose 20 points from 2019—and Miami had the lowest.
THE AGGLOMERATION GAP
THE DIFFERENCE BETWEEN ACTUAL AGGLOMERATIONS under current WFH conditions and the agglomerations that could materialize if cities achieve activity densities that prevailed before WFH can be defined as an agglomeration gap. The technological innovations that enabled WFH are unlikely to adversely affect the productivity resulting from in-person interaction, so if density returns to prepandemic levels, agglomeration benefits would do the same. In addition, productivity in areas outside cities may have increased with the rise of WFH and associated technologies, making cities less competitive even if they returned to their prepandemic productivity levels.6
Some cities may have a small or no agglomeration gap, meaning their economies are well structured to adapt to WFH. A small agglomeration gap may occur if commuting costs are low, reducing the incentive to work from home and thus supporting in-person work. Additionally, cities with economies that rely on industries requiring in-person interaction, such as health care, hospitality, and manufacturing, may also have a small agglomeration gap due to the necessity of physical presence in these sectors.
Cities with agglomeration gaps are often large, with substantial premiums for residential and commercial real estate, higher wages, and long and expensive commutes. In these cities, the newly available choice of WFH may result in private savings but lower the productivity of in-person work by reducing agglomeration economies. That people may not bear the full cost of their decision to work from home makes this market outcome inefficient. This so-called externality results in an undersupply of in-person workers that will shrink a city’s productivity and competitiveness.
Sustained over a long period, large agglomeration gaps will undermine the economic base of cities. Public and private infrastructure designed to support high-density activities will be underused and, effectively, need to be recreated in other areas as economic activity moves to different locations. Moreover, failing to fill the agglomeration gap could result in significant economic and fiscal losses to cities, regions, and the country if more decentralized work patterns are insufficiently productive.
In the following section, we explore how agglomeration gaps may vary across cities according to their size and other characteristics. Cities with small or near-zero agglomeration gaps are well suited to prosper from WFH, which will add to potential employment opportunities. Cities with low agglomeration gaps do not need to adopt policies to either support or reduce WFH. Rather, they need to remain attractive to households and offer low costs for businesses that are not highly dependent on innovation generated by in-person interaction.
Theoretical basis and empirical findings
The gap in cities’ agglomeration economies is the result of the profound change in the relationship between where people live and where they work—a change driven initially by the lockdowns during the COVID-19 pandemic. These lockdowns drove commuting levels to nearly zero and forced businesses and workers to adapt to remote work conditions overnight.7 As restrictions eased and public confidence rebounded, workers began trickling back to offices—at least part time—in large and small cities. Eventually, many employees in small cities returned to their workplaces. That was not the case in large cities.8
The reason for this difference in return-to-work patterns is due to varying incentives for workers. Smaller cities have fewer commuters, shorter commutes, and less clustering of economic activities. In these communities, the cost of commuting to the workplace is low compared with the benefits of working with colleagues in person.
In larger cities, longer commutes, congested roadways, and crowded transit lines create disincentives to return to offices, while the higher cost of living creates an incentive to move farther from the city or out of the region entirely. There are many other compelling reasons people choose to work from home. They include flexible hours; extra time for family, friends, and leisure activities; and a more comfortable work environment.
Because fewer people are commuting to the central business districts of large cities five days a week, the negative impacts of WFH are compounded. Downtown areas are less vibrant because there is lighter foot traffic, and the value of going into the office depreciates because fewer coworkers are there. Less collaboration occurs, fewer ideas are exchanged, and productivity stagnates. This is known as the coordination problem of WFH. Workers may be better off over the long term working in the office if everyone else is. Instead, all too often, workers go to the office only to have meetings with colleagues online.
Quantifying the Agglomeration Gap
We develop a simple model to calculate the agglomeration gap.9 Quantifying this gap is important, particularly because the relationship between city employment and wages significantly influences larger cities, such as New York. The model incorporates key metrics regarding agglomeration economies, commuting, and the impact of WFH to show the gains and losses to in-person and WFH workers. It also evaluates the aggregate impacts on the net benefits or losses from WFH for the five cities in our study.10
Several key methodological assumptions underly our framework:
1. If agglomerations are equivalent to what they were before the pandemic, then economic productivity postpandemic will at least match, and possibly exceed, prepandemic economic productivity;
2. In-person interaction is key to agglomeration economies, and WFH reduces scale agglomeration just as a job elimination would;
3. Agglomeration losses are based on midterm impacts (-0.8 percent), which are reached after eight years;11
4. People choosing WFH do so rationally on a forward-looking basis in that they choose remote jobs if the prospective benefits of WFH outweigh the direct costs of going to the office;
5. Wages of WFH workers eventually fall because of a loss in agglomeration-related productivity;
6. The framework is calibrated to ensure that after the full decline in WFH wages, the marginal WFH worker is equally well off with in-person or WFH work;12
7. Prior to the full realization of wage decline related to reduced agglomeration, WFH workers are unambiguously better off; and
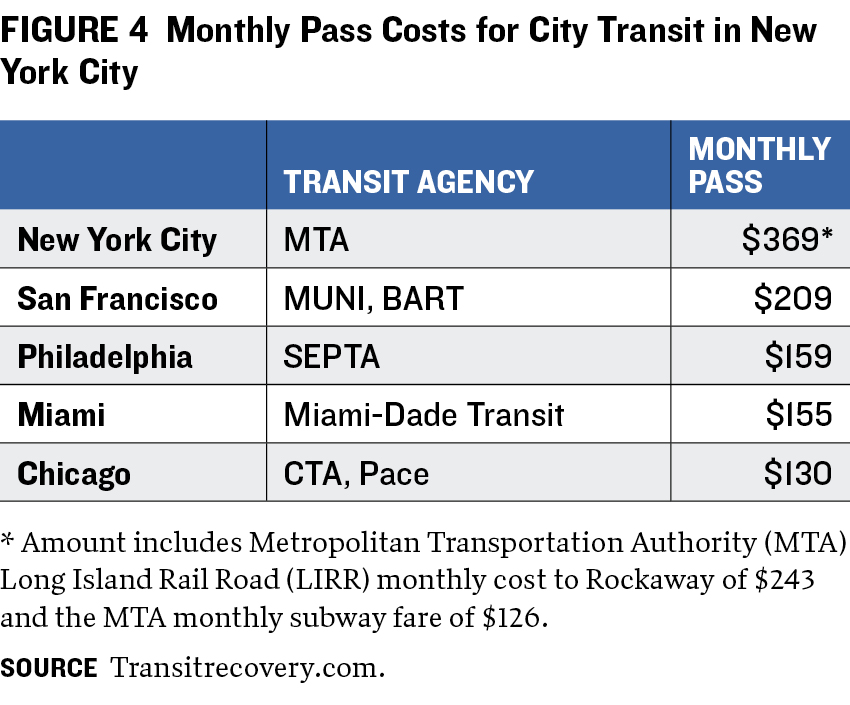
8. Commuting costs are estimated as the sum of time costs, which are a function of wages, and the out-of-pocket cost of commuting by public transit via monthly passes.
Results for New York City
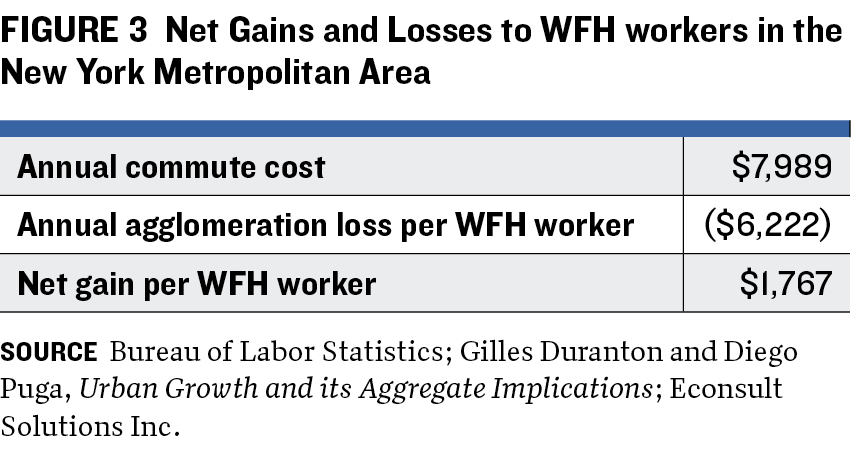
As shown below, figures 2 and 3 provide insight into the size of the agglomeration gap for cities and its implications for the fiscal challenges that they face. In addition, figure 2 displays the potential aggregate loss in productivity for both in-person and WFH workers. Focusing initially on New York, we discuss these issues in depth.
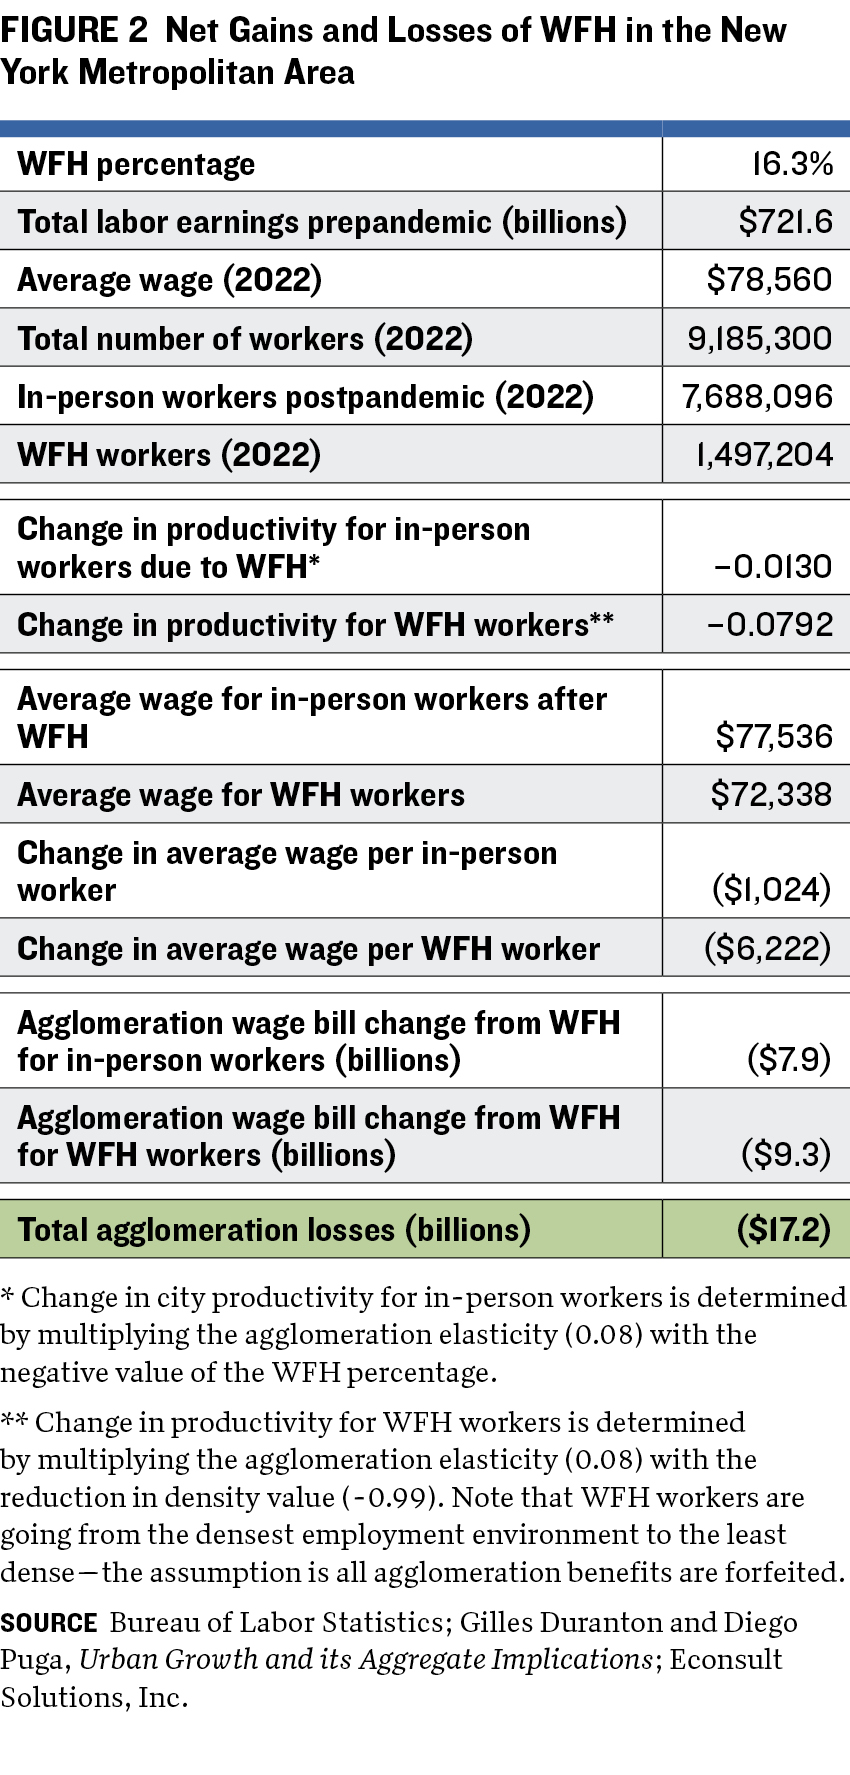
As the largest metropolitan area in the US, New York has historically generated the largest positive agglomeration impact. We estimate that the high rate of WFH in New York City reduces the benefits of agglomeration and could cost in-person workers about $7.9 billion annually.13
The high rate of WFH has been driven in part by high commuting costs. High wages drive up the time cost of commuting, and the sheer size of the metropolitan area, combined with elevated housing prices near Manhattan, means people have to live further from job centers and spend more time commuting.
While the losses in estimated in-person wages are significant, the fiscal losses of jobs leaving the city because of WFH are much greater. In the long run, many WFH jobs are likely to be filled by people moving to lower-cost locations outside the fiscal reach of the New York City tax system. In conjunction with the agglomeration losses, the shift to WFH would generate a total reduction in earnings of in-person and WFH workers of over $17.2 billion annually.14 The ultimate fiscal impact of these loses will depend on the share of remote work done outside the city, but it is reasonable to expect a good portion of employees to migrate to lower-cost municipalities.
Workers who leave New York City because of WFH will necessarily be moving to lower-agglomeration places, which will result in lower wages in the long term. We estimate that over time, wages for those working from home will be almost 7 percent lower than fully agglomerated in-person wages. Wages will fall by about $6,200 per WFH worker, for an aggregate decline in earnings of $9.3 billion annually. While wage losses will be roughly offset by savings in commuting costs,15 the total lost economic value resulting from WFH is a little less than $9.1 billion annually, with a net present value over a thirty-year horizon (with a 3 percent discount rate) of $102 billion. New York will bear much larger fiscal losses because of the significant shift in employment to outside the city.
Results for Other Cities
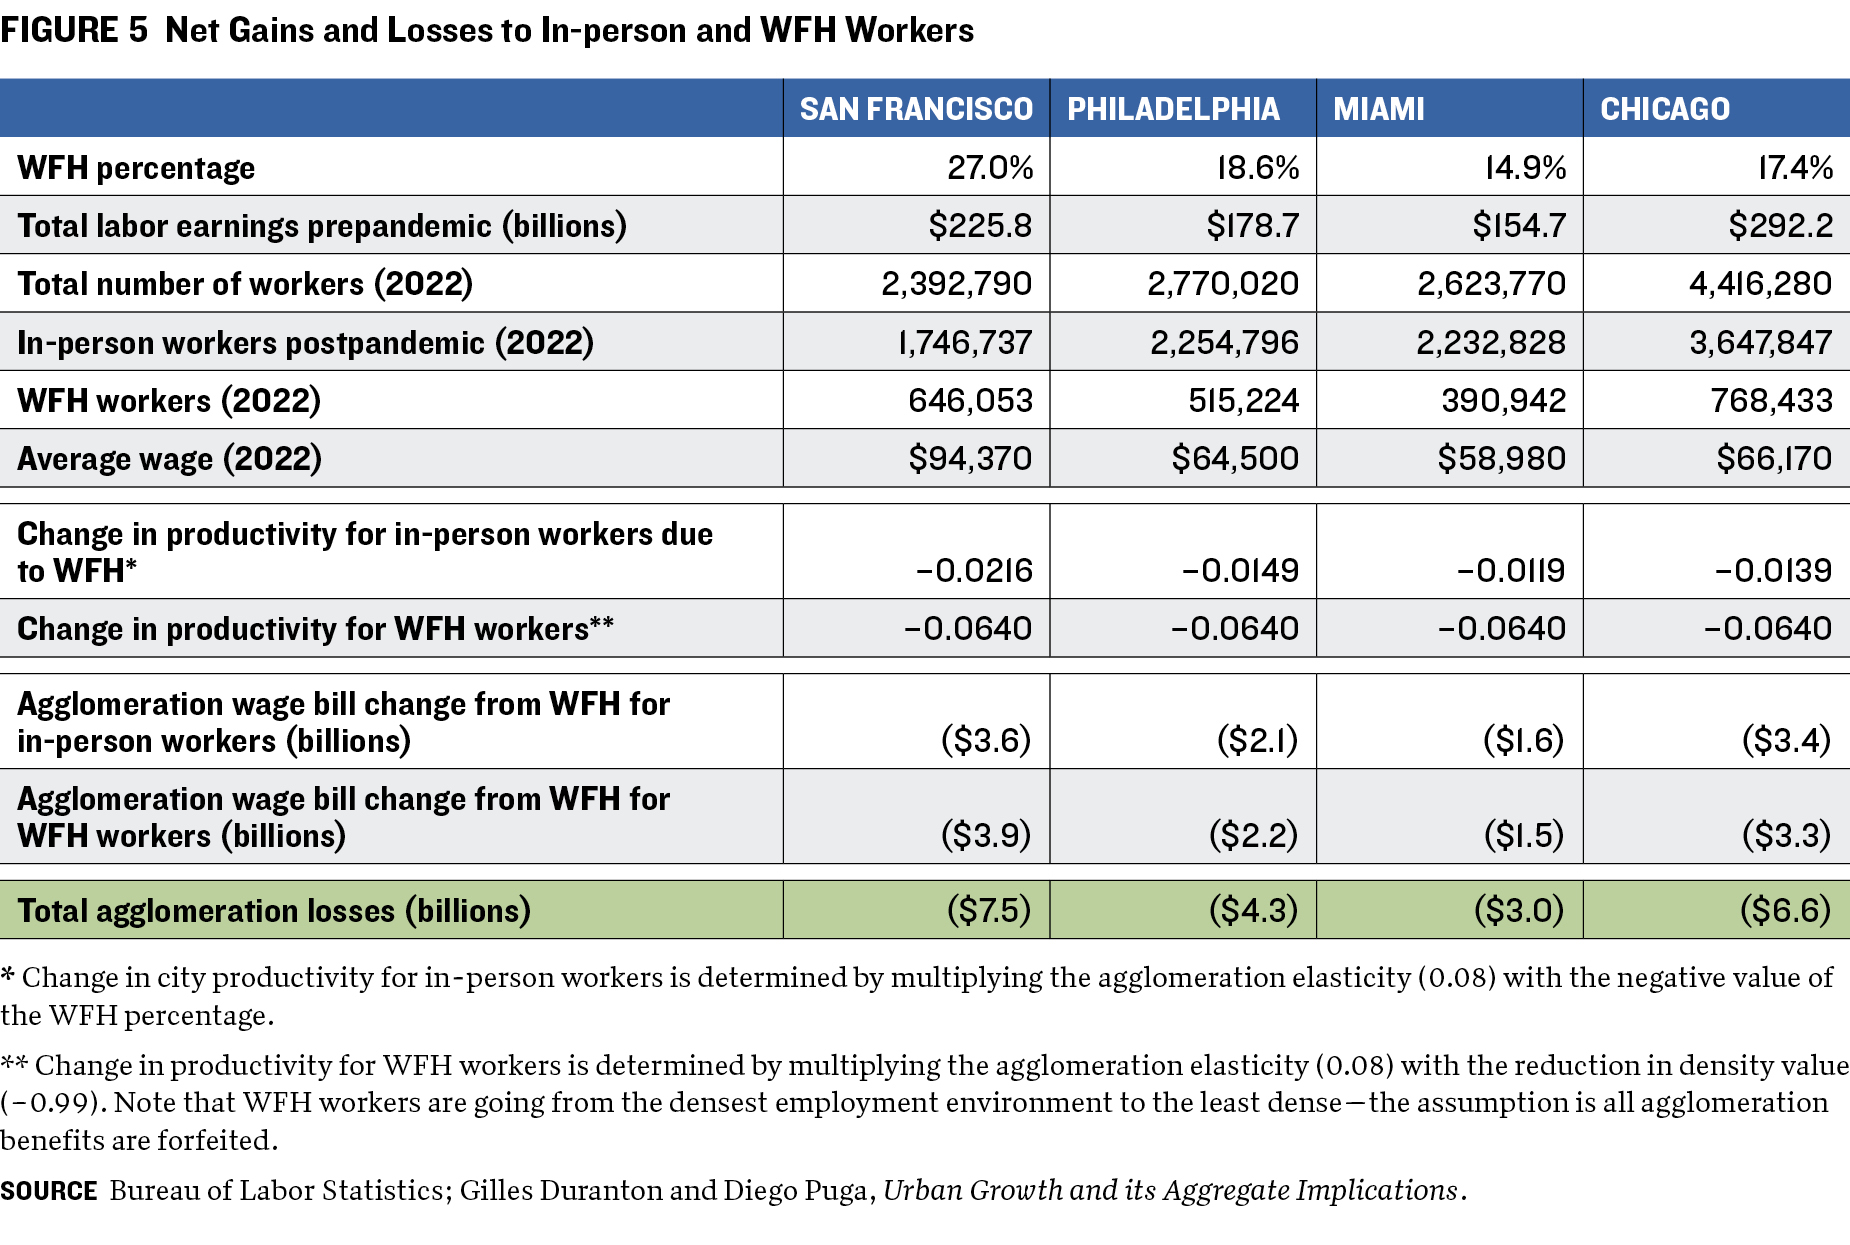
Figure 5 demonstrates similar patterns in four other cities to those found in New York. None of these cities, however, matches New York for the magnitude of the WFH challenge. The total economic loss for the other four, in absolute terms and considering their economic size, is estimated to be lower than that of New York. Save for San Francisco, the estimated change in productivity for remote workers in these four cities is expected to be lower than that of New York, taking density into account. As in New York, fiscal losses for these cities will be significant because of the drop in wages, both for in-person and WFH workers, as a result of agglomeration losses and larger fiscal losses from the exodus of taxable economic activity. Long term, the total agglomeration losses for the four cities will range from $3.0 billion to $7.5 billion. San Francisco is estimated to be at the high end of that range, largely because its lofty rate of remote work has led to a larger productivity decline. It has also experienced a loss in agglomeration valued at $6.6 billion, reflecting the size of its economy and labor market. Philadelphia and Miami are next, with losses of $4.3 billion and $3.0 billion, respectively.
CITIES AND MARGINS OF ADJUSTMENT
THE IMPACT OF WFH ON CITIES IS SHAPED by the decisions made by households, firms, and governments, which are reflected across various markets, including housing, commercial real estate, labor, and transportation. In turn, these changes in the market influence the decisions of households and firms.
In this section, we describe how the behaviors and choices of households and firms may be influenced by incremental changes in market conditions caused by WFH. We refer to these changes as margins of adjustment.
To illustrate, we use the market for commercial office space. An immediate result of the ability of people to work from home is less demand for traditional office space and more demand for residential workspace. Several market responses follow:
• Office rents and building prices will fall;
• The supply of new office space will decline;
• Buildings will be taken off the commercial market or converted to other uses;
• Fewer people will use public transportation infrastructure; and
• Residential real estate prices will rise along with the demand for space because of people’s need for a home office.16
As this demonstrates, a change in the market conditions for commercial office space affects supply and demand across multiple markets. While it is difficult to predict how household and firm behavior will change in this uncertain time, it is important for policymakers to understand how market conditions could evolve, how households and businesses may respond to these changes, and how those responses will affect long-term outcomes for a city. Adopting the right policies can help direct the city’s economy toward a smooth Recovery or Virtuous Boom Loop scenario; adopting the wrong ones may lead to Doom Loop Prevails.
Household and Firm Choices
For most of modern urban history, the location decisions of households and firms have been predictable. People traditionally favor living in cities for economic opportunities, access to amenities, and social engagement. For most people, the choice of where to live in a city is influenced by conditions for commuting to work five days a week.
With employees able to get to work relatively easily, many firms were able to occupy office spaces large enough to accommodate their entire workforce in or near urban cores. Since the onset of the pandemic, these conventions have been upended.17
With the ability to work from home and improvements in supporting technology that have expanded in recent years, households are no longer bound by the need to live in cities for economic opportunities and social interaction. This shift allows households greater flexibility in choosing where to live, leading to significant benefits, such as savings on commuting and more spacious and affordable housing.
Similarly, firms have incentives to move toward remote and hybrid work. The arrangement means companies need less office space, saving significant expenses on real estate. Firms are no longer compelled to locate offices in expensive urban centers but can put roots in places with probusiness environments and lower or no corporate income taxes. This trend is evident in cities like Miami, which firms are moving to from cities in higher-cost states like New York and California.
These changing incentives have prompted shifts in decisions, made by both households and firms, that have consequently impacted housing, commercial real estate, labor, and transportation markets.
Markets
When prices reflect the full cost of a choice, markets produce socially desirable outcomes. In the presence of market externalities, however, the market alone will not necessarily lead to a good outcome.
If, for example, conditions do not warrant firms maintaining sufficient in-person employment to sustain agglomeration economies, commercial rents and wages will fall. Ultimately, it will not be profitable for some space to remain on the market. Productivity declines will reduce employment, although any declines will be partially offset by lower wages. This will result in excessive fiscal losses for the city, as well as aggregate losses in productive capacity. As such, government investment and policies may be needed to align private incentives as closely as possible with outcomes that reinforce the city’s agglomeration economies.
Government
Governments must craft policies that enhance the attractiveness of cities and maximize fiscal returns in the new environment of flexibility in where people can work. By implementing such policies and making strategic investments, governments can help shape market outcomes. The goal should be aligning the incentives for households and firms with increasing agglomeration benefits while reducing traffic congestion and pollution. Doing so can boost economic productivity and improve the quality of life for city residents and workers.
Major policy areas that ultimately affect WFH choices include transit and transportation, housing supply and affordability, public safety, and quality of life. For example, public transit agencies will need to adjust service patterns to meet changing demands associated with greater workplace flexibility. Cities will also need to figure out how to increase housing construction to reduce commuting time and costs to be competitive with WFH in suburbs. Providing public services and amenities that ensure a high quality of life may influence the incentives for households and firms to decentralize.
For a discussion of market outcomes since the pandemic, see Appendix B.
STRENGTHENING CITY ECONOMIES
CITY LEADERS AND DECISION MAKERS SHOULD ADOPT policies that address the challenges and leverage the opportunities created by WFH. Smaller cities with limited or no loss in agglomerations due to WFH should orient policies toward attracting more remote workers. Larger cities, like New York, that have experienced a loss in agglomerations due to WFH should adopt policies to attract industries and employees that benefit from or require in-person work. Policies designed to narrow the aggregation gap should include:
1. Promoting the city to industries that benefit most from agglomeration economies, especially knowledge-based employers. Firms should consider using remote workers for tasks that do not require physical presence or agglomeration, thus optimizing operational efficiency and enhancing profits.
2. Enhancing the flexibility and quality of public transit services, with a focus on improving services for off-peak commuters. This should include implementing congestion pricing measures to alleviate traffic, encourage the use of public transit, and generate revenue for transit services.
3. Reducing the cost and increasing the pace of housing production. This is crucial to maintaining the competitiveness of the city as a place to live and work and increasingly important in light of WFH. To increase the supply of housing, the repurposing of vacant office space to residential units should be encouraged via regulatory reforms to streamline construction along with, changes in zoning regulations and fiscal incentives such as tax abatements.
4. Building amenities to attract residents. While this may require comprehensive planning, empirical evidence suggests that amenities play a crucial role in supporting high-density living and are outsize factors influencing residential choices.18
5. Ensuring that the municipal tax system supports in-person work. Municipalities can offer tax incentives for businesses to encourage in-person work. For example, cities might offer a break on occupancy taxes that are tied to the number of hours employees work from the office.
APPENDIX A
WFH TOOL KIT: THREE PATHS FORWARD FOR NEW YORK CITY
WFH-INDUCED SHIFTS OF TAXABLE ACTIVITY outside cities have implications for cities’ fiscal health that depend on the structure of each municipality’s revenue sources. In the short term, cities had lower revenues from all major revenue sources, including property, sales, and income taxes, fees, and charges due to the 2020 lockdowns and recession sparked by COVID-19. Longer term, some predict a revenue shortfall of 5.5–9.0 percent, with variations across cities depending on differences in revenue structures and the fiscal condition of states going into the recession.19
In this section, we examine the fiscal implications of WFH for each of the five cities studied, in the short and long term. We examine what the fiscal implications of WFH have been so far and what is expected under three alternative scenarios:
Doom Loop Prevails Cities’ competitiveness is permanently lower, and potential agglomeration economies are not realized in equilibrium. This scenario can also result in a vicious cycle of decline as fiscal constraints result in deteriorating services, fostering further decline.
Recovery Cities fully regain their prepandemic levels of agglomeration economies.
Virtuous Boom Loop Arises Cities prosper as increasing concentrations of in-person workers benefiting from agglomeration generate higher productivity, while tasks not requiring in-person activities are reduced by WFH.
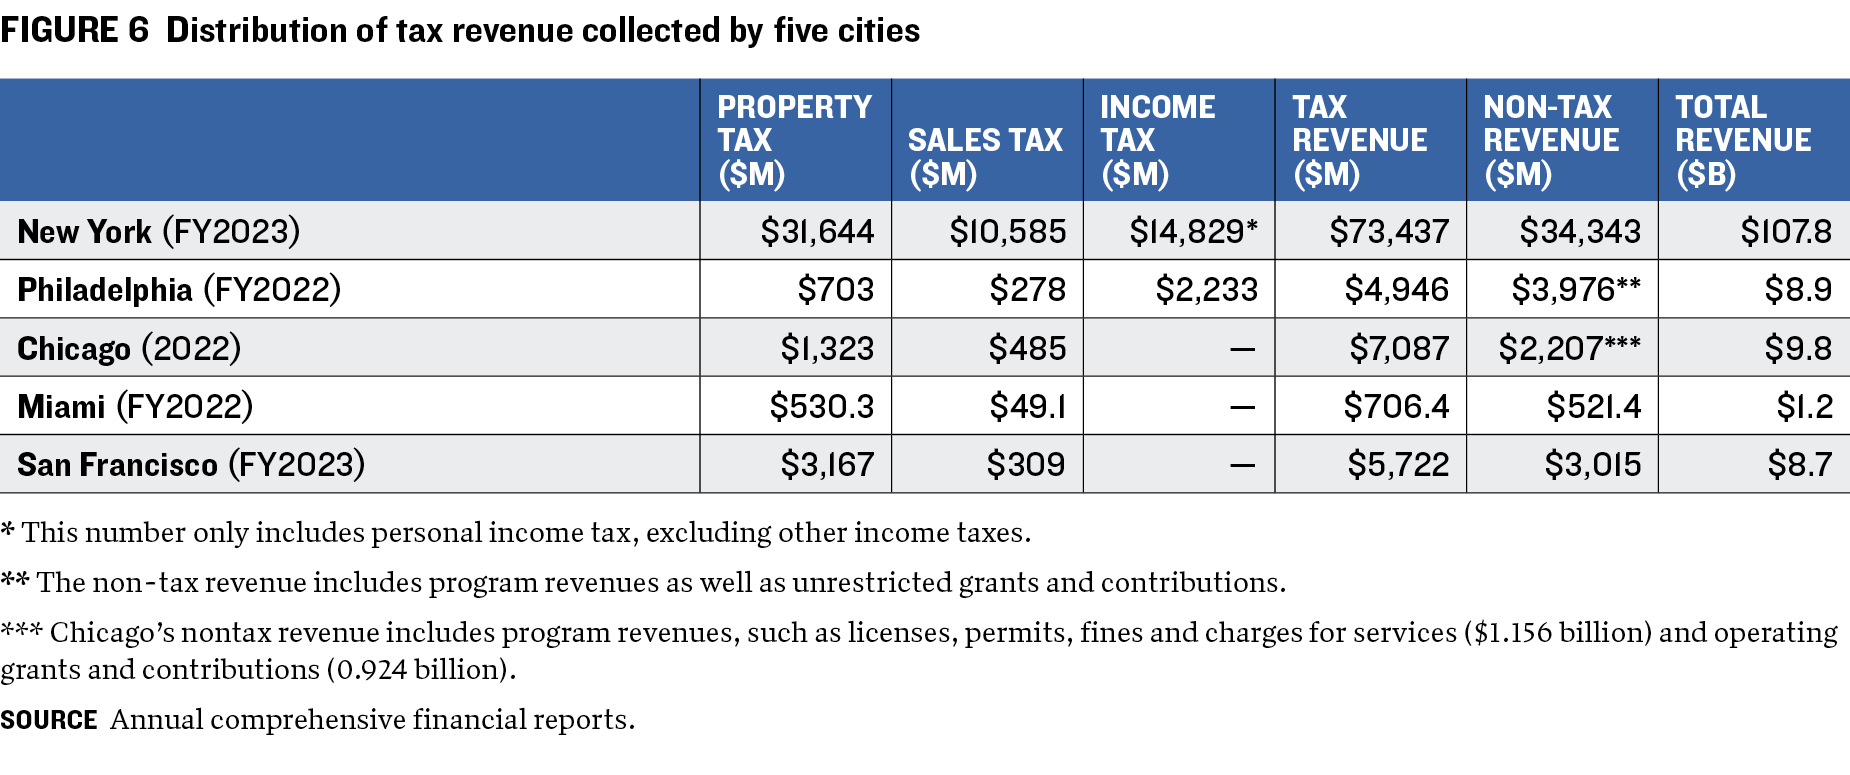
Figure 6 provides an overview of major revenue sources for New York and the four comparison cities. There is a considerable variation in the tax bases of the five cities. New York’s revenues, along with those of Miami and San Francisco, are diversified across property, sales, and income taxes, but property taxes are still significant sources of cash. Chicago and Philadelphia are the least dependent on property taxes. Philadelphia is fueled by income taxes on residents and commuters, while Chicago counts heavily on property taxes and nontax revenue such as program revenues. Miami and San Francisco have no income tax and only modest dependence on sales taxes. Cities with a broad tax base may benefit from less variation in tax revenues, but in the long term, cities’ fiscal capabilities are related to the equilibrium size of their economies.
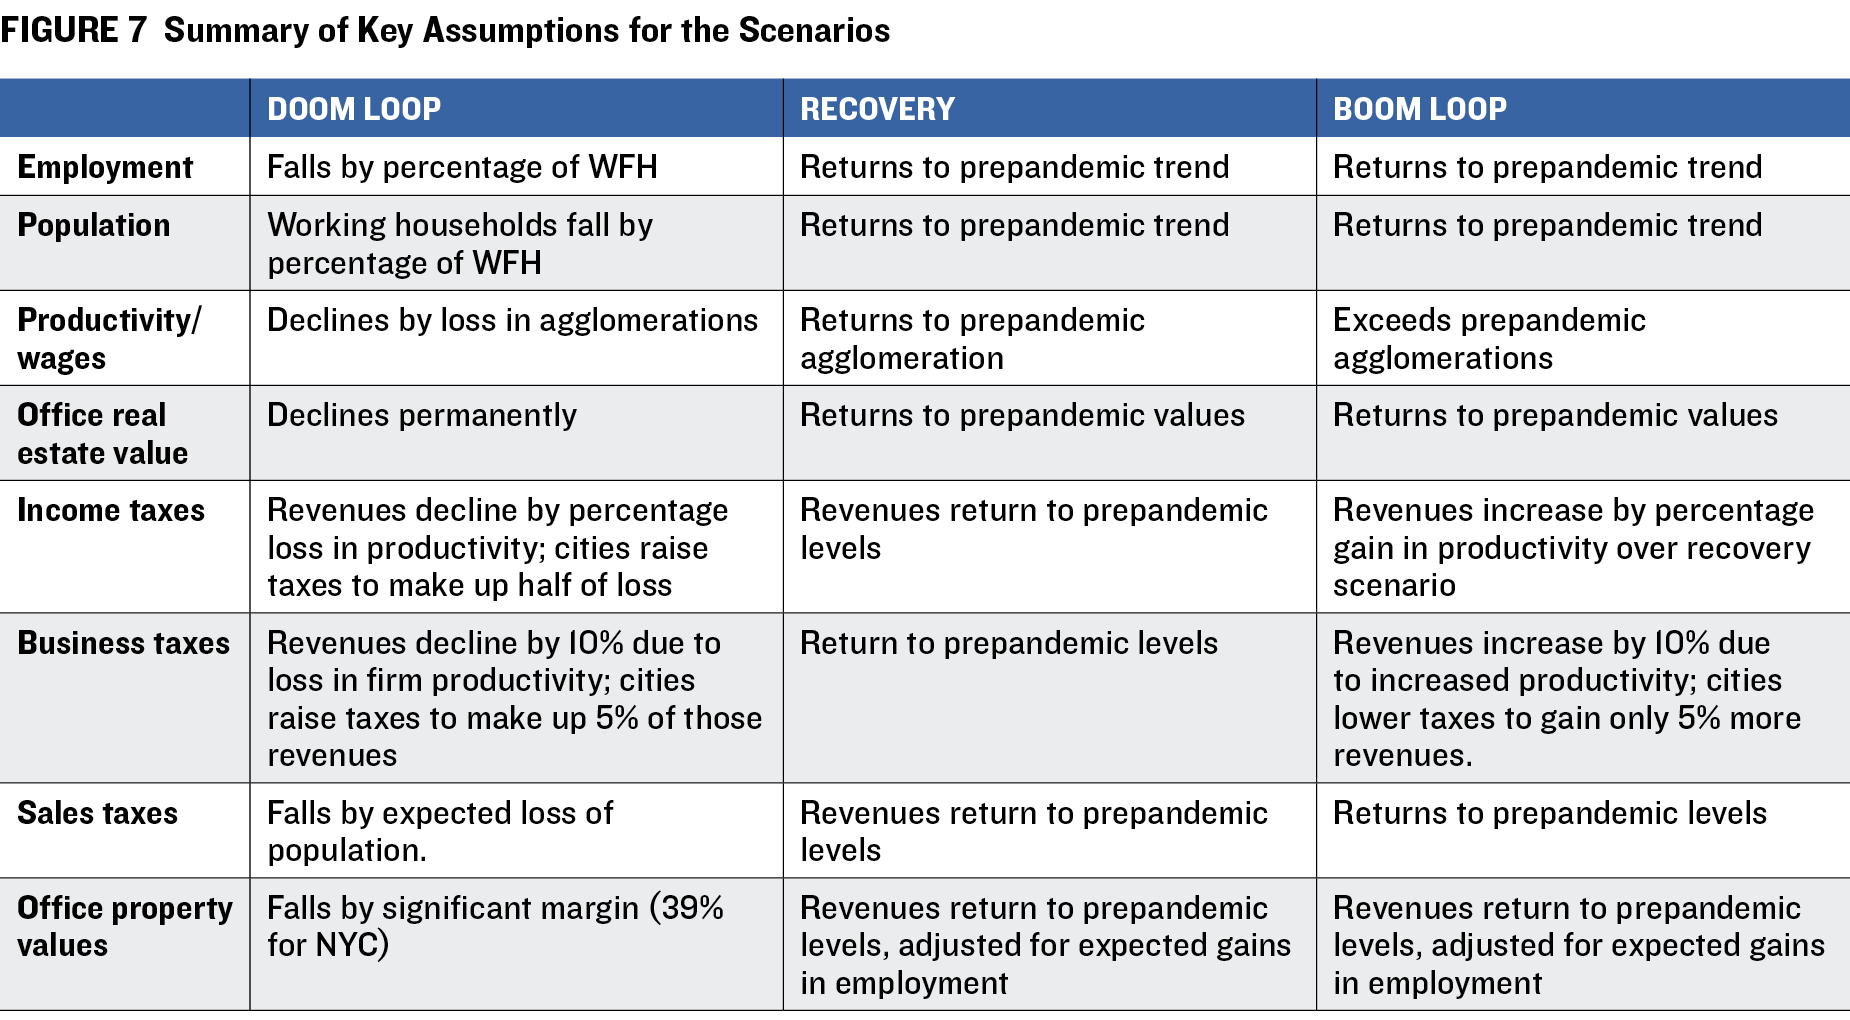
Scenarios and Assumptions
These scenarios build on the “Urban Doom Loop” hypotheses developed by Stijn Van Nieuwerburgh, a professor at the Columbia Business School, which serve as the basis of the first scenario, Doom Loop Prevails.20 Van Nieuwerburgh argues that if employees continue to work remotely and avoid commercial districts, the resulting decline in billions of dollars from real estate, transportation, and other government revenues could require reductions in critical services. This might fuel social problems like increased homelessness and worsened commuting conditions—creating a cycle in which more workers would opt to stay away. There may be longer-term forces that have not yet been felt, as we discuss below.
The Recovery scenario follows a return-to-normal situation in which cities adjust to the impacts of the initial shock of WFH. Remote work remains a vital part of the economy and some residents may leave the city, but the number of people working in the city returns to prepandemic levels and the city’s population continues to grow. Worker productivity remains the same as before the pandemic, and the city’s fiscal situation reverts to the historical mean.
The Virtuous Boom Loop Arises scenario contains the same elements as Recovery, with two exceptions. First, firms will allow employees who benefit less from working in person to work from home and will use the office space they formerly occupied to hire and house additional employees who benefit more from working on-site. Bringing together more workers who benefit from the agglomerations of the city will increase firms’ overall productivity.
Second, firms will get larger, drawing on a larger and less expensive labor pool. They will rent equal or more amounts of office space to accommodate their more productive, in-person workers and rents will increase. Revenues from income, sales, and property taxes will rise. Demand for housing in the city will climb, boosting residential property values while also affecting affordability.
The assumptions of these scenarios include:
• For the long-term, we assume an eight-year time horizon across all three scenarios.
• In the Doom Loop Prevails, we hypothesize cities’ competitiveness is permanently lower and potential agglomeration economies are not realized.
º We assume that all workers working from home leave the region in search of areas of lower cost of living while maintaining higher wages.
º The population of working households falls by the same percentage of WFH workers.21
º Productivity (wages) declines as described in the section above on the agglomeration gap.
º Real estate values fall. A 39 percent decline in office property values in New York City is assumed.22
º For fiscal implications, we apply a per-resident rate for income and sales tax revenues, based on the total tax revenue collections reported by the city governments in fiscal 2019. For business taxes, a 10 percent decrease in overall productivity is assumed. We assume a loss of business tax revenues by 10 percent, but cities will raise tax rates to offset half of those losses. We apply the same rate of reduction (39 percent) to the values of commercial real estate tax levies on office properties.
º As discussed in the previous section, we assume the government raises property tax rates to make up 50 percent of the total loss (for New York City, this makes up 20 percent of the total loss in tax revenue).
º This analysis assumes that the equilibrium outcome is reached after eight years but does not quantify the very real potential for a disequilibrium cycle of decline associated with fiscal constraints and declining services. This is like what occurred in many US cities in the 1960s and 1970s.
• In the Recovery scenario, we hypothesize cities fully regain their prepandemic levels of agglomeration economies.
º Population and employment growth return to prepandemic levels. Projections for population and employment in 2030 by the New York Metropolitan Transportation Council (NYMTC) have been used for this scenario.23
º Productivity remains steady and wages remain constant as cities regain their prepandemic agglomeration economies.
º Office real estate prices recover to prepandemic levels.
º For tax revenues, the same per capita approach is applied. We use the rate based on the total tax revenue collections reported by the city governments in fiscal 2019 and apply that rate to the projected population and employment.
• In Virtuous Boom Loop Arises, cities prosper as an increased concentration of in-person workers benefiting from agglomeration generates higher productivity, and the volume of other tasks not requiring in-person activities is reduced by WFH.
º Similar to the Recovery scenario, population and employment growth return to prepandemic levels. NYMTC’s projections for population and employment in 2030 have been used for this scenario.
º Wages increase as potential agglomeration economies grow; through the mechanics of margins of adjustments, the economy readjusts for better productivity. We assume that firms will become 10 percent more productive and that cities will lower corporate tax rates to retain a 5 percent increase in revenues.
º Office real estate prices recover to prepandemic levels.
º The same per capita approach is applied for fiscal implications (see assumptions for the Recovery scenario).
New York
Economic Impacts of WFH Driving Fiscal Outcomes
Among the five cities, New York had the second most substantial increase (after San Francisco) in the percentage of WFH from 2019 to 2022, leaping from 4.8 percent to 16.3 percent. The city is the largest US labor market, supporting about 9.6 million employees; in 2022, approximately 1.6 million people worked full time from home. This high rate of WFH is partly due to the commuting expenses, which make WFH relatively more attractive. At the same time, potential agglomeration losses are the highest in New York City.
COVID-19 significantly disrupted the economic landscape in New York City during the initial phases of the pandemic. What followed were widespread business closures, declines in consumer spending and corresponding losses in retail sales, a falloff in the tourism and hospitality industries, a sharp reduction in demand for office space, and a slide in transit ridership.24
Some of these negative trends have improved since the pandemic. New York City’s retail, dining, and hospitality sectors are recovering, with over 56 million visitors traveled to the city in 2022 and 61 million visitors projected for 2023, compared to 67 million in 2019, according to NYC Tourism & Conventions. Public transit ridership is also moving toward prepandemic levels; as of March 2023, Metropolitan Transportation Authority (MTA) subway ridership was at 75 percent of prepandemic levels, with more than 4 million people returning to the rails on a weekday.
One key risk to New York’s economic outlook, as identified by the city comptroller’s office, involves the adjustment of commercial real estate—particularly the office sector—to lower demand for space, higher interest rates, and tighter lending standards. Approaching the fourth quarter of 2023, a supply-demand imbalance persisted in the office market. Demand for space remained weak, which resulted in office utilization well below prepandemic levels, as indicated by card-swipe data from Kastle Systems. Office availability rate remained elevated, at 16 percent, compared with 11 percent observed before COVID-19 arrived in early 2020. The decline of in-office work since the onset of the pandemic continues to adversely affect leasing activity in the city, which has led to lower valuations for office buildings. This uncertainty, coupled with interest rates at their highest level in over a decade, has resulted in value declines of 30 percent in some office building deals, such as the sale of One Liberty Plaza in early 2023.
In contrast to the glut of office space, the city’s apartment market remains robust and characterized by high demand from renters competing for a limited number of units. Indeed, the short-term fiscal impact of WFH has been somewhat muted because many people who work from home have remained in the city and continue to generate tax revenue. The vacancy rate stands at 2.5 percent, making New York City the tightest among US markets. Despite the city being the second-most-expensive market, after San Francisco, positive absorption levels and private sector job growth since the start of 2021 indicate a continued influx of renters. Contrary to initial concerns about the apartment market being affected by a drop in office utilization, New York’s dining, culture, and art scene are proving to be more important drivers of demand for renters than a physical office location. According to data compiled by CoStar, a provider of information on commercial real estate, demand is expected to lag supply in the near term, with approximately 65,000 housing units (4.2 percent of existing inventory) under construction.25
Fiscal Implications: Short Term
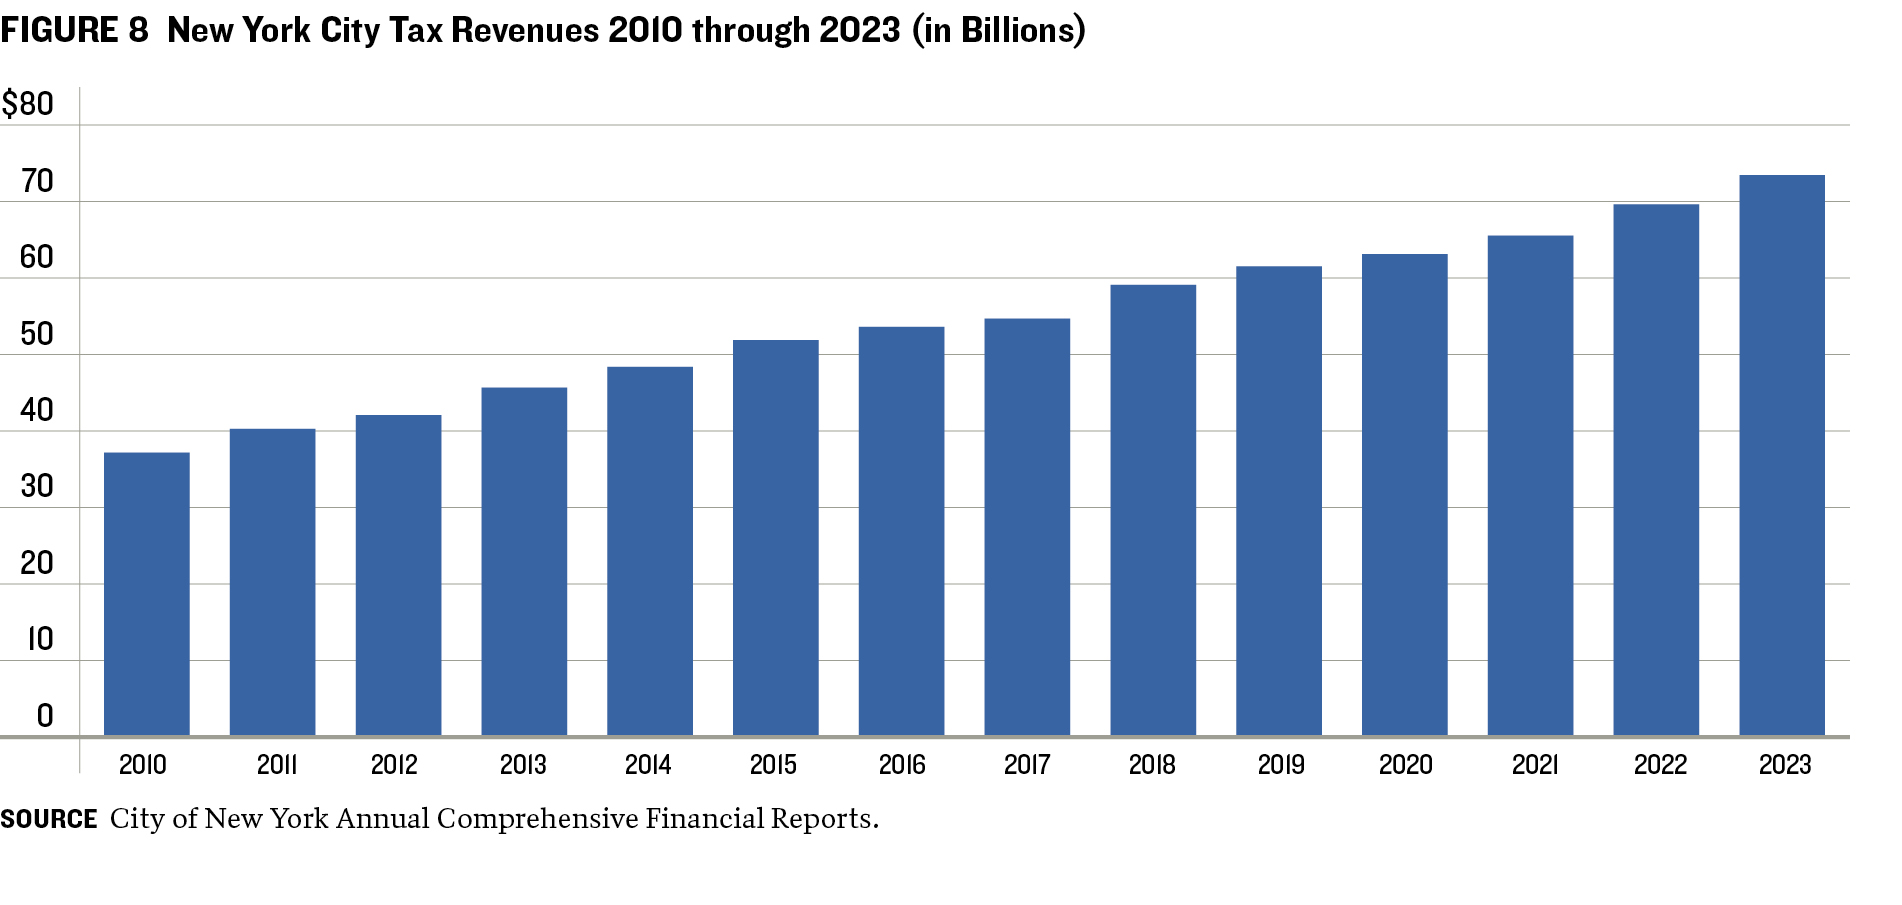
In fiscal 2023, New York City’s revenues surpassed budgeted amounts, aligning with historical trends. Although to a lesser extent than in recent years, it still exceeded the prepandemic levels. The path of aggregate city tax revenues from 2010 through 2023 is shown in figure 8.
Tax revenue from commercial real estate will most likely continue to weaken over the next few years as a result of weak demand and declining building values. Real estate taxes accounted for 53 percent of New York City’s budget in 2020; 24 percent of that came from office and retail property taxes. So, the decline in office values and the surrounding central business district retail properties may lead to increasing tax rates or cutting government spending.26
Fiscal Implications: Long Term
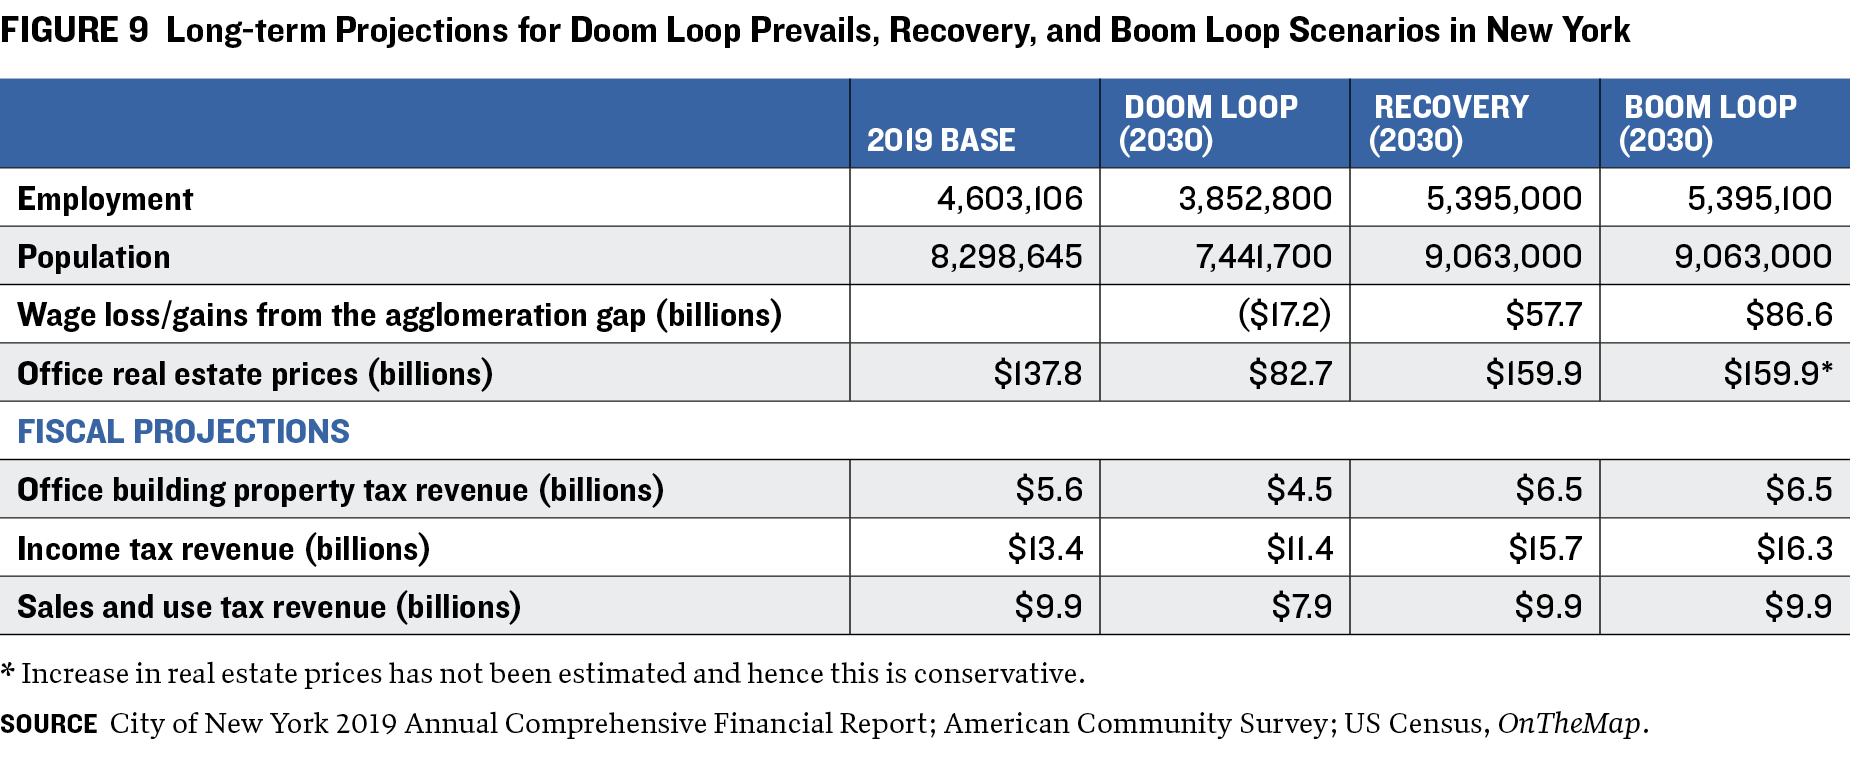
Longer term, the city has significant challenges as well as significant opportunities. Figure 9 displays fiscal projections for the three scenarios for New York.
Doom Loop Prevails In this scenario, New York City faces a stark transformation driven by the widespread adoption of WFH. This scenario models an extreme shift, with the assumption that all employees working remotely will leave the city permanently. This exodus leads to the workforce shrinking to 3.9 million and the population dropping to 7.2 million by 2030—declines of 16.3 percent and 13.0, respectively. The wage bill falls by about $17.2 billion because of the diminished size of the agglomeration economy. In terms of real estate, the scenario predicts a 39 percent decline in the value of office space, for a total market value of $82.7 billion.
Property, income, sales, and corporate tax revenues are expected to decline under Doom Loop Prevails. Office building property tax revenues are expected to fall to $4.5 billion. Income tax revenues will decrease to $11.4 billion from $13.4 billion in 2019. Similarly, sales and use tax revenues are projected at $7.9 billion, down from $9.1 billion in 2019.
Doom Loop Prevails paints a difficult, if unlikely, picture for New York and highlights the potential risks of cities’ not adapting to WFH. It underscores the need for policymakers to consider strategies that can mitigate these risks and focus on ways to keep the city appealing to both residents and businesses.
Recovery In the Recovery scenario, New York gradually overcomes the challenges of WFH and marks a period of change and evolution rather than a simple return to prepandemic norms. This scenario is characterized by a transformation in the composition of the workforce within the city as firms adapt to adjustments in real estate prices, with some downsizing and others moving into more affordable spaces. Employment and population levels stabilize to prepandemic trends, indicating the city’s continued appeal.
Recovery is not without limitations, however. The city’s competitive advantage is somewhat compromised because of the increasing attractiveness of other locations, which benefit from lower investment requirements and housing costs. The wage bill sees a comeback (though not to the extent in Virtuous Boom Loop Arises) with a smaller increase that reflects the city’s somewhat confined economic dynamism. Office real estate values partially recover, reflecting a steady demand for office space but not at the prepandemic peak. This leads to a moderate increase in property tax revenues, to $6.5 billion. Income tax revenues rebound but do not reach the heights of Virtuous Boom Loop Arises, settling at around $14.5 billion. Sales and use tax revenues also improve, but the growth is limited, with collections reaching about $8.5 billion.
The Recovery scenario highlights the resilience of New York City but also underscores the city’s unaddressed challenges. Fundamental issues such as the high costs of housing production and expensive commutes continue to pose barriers to the city’s full economic potential. For policymakers, this scenario suggests the need for targeted strategies to enhance the city’s competitive advantages while addressing its longstanding problems. Investments in infrastructure and quality-of-life improvements are important, not only to attract residents and businesses back to the city but to lay the groundwork for continued growth.
Virtuous Boom Loop Arises In Virtuous Boom Loop Arises, New York leverages the changes of WFH to achieve an economic upswing. This optimistic view is underpinned by the city repeatedly capitalizing on the strength of its agglomerations by adapting to new work patterns and shifting economies. In this scenario, employment and population grow at the same rate as in Recovery, highlighting the city’s ability to remain attractive to both residents and businesses despite the allure of WFH.
The key feature of this scenario is workers’ higher productivity due to firms’ successfully integrating WFH into the economy, resulting in a wage premium of $86.6 billion, a net difference of about $100 billion with Doom Loop Prevails.
Virtuous Boom Loop Arises presents a promising fiscal picture for New York. Like in the Recovery scenario, office real estate values and related property tax revenue return to prepandemic levels. Sales taxes also recover to those conditions. Income tax revenue increases to $16.3 billion, higher than in the Recovery model because of workers’ greater productivity.
Virtuous Boom Loop Arises emphasizes the dynamism and adaptability of New York. For policymakers, the scenario shows how the challenges of WFH can translate to a restructuring of its economy in a way that allows the city to leverage its agglomeration to support economic diversification, encourage innovation, and foster an environment conducive to business growth and urban livability. Policymakers should invest in the necessary infrastructure and quality of life amenities that encourage more people and businesses to move to New York City.
Conclusion
Each of the scenarios presented above—Doom Loop Prevails, Recovery, and Virtuous Boom Loop Arises—is plausible, with economic reasons supporting the potential for each to occur. Factors beyond the control of policymakers and civic leaders, such as the preferences of consumers, global markets, and other external economic conditions, may play a significant role in shaping the outcomes for cities. However, cities can influence their trajectory by adopting policies that encourage more in-person work, address the costs and duration of commuting, and increase the affordability of housing, among others. Nonetheless, these policies are no guarantee of a prosperous future. The most important component in the economic equation of cities’ futures is the value of in-person work and its implications for agglomerations. Has in-person work been devalued permanently, or will a higher premium be placed on in-person work, strengthening agglomerations in the future? if in-person work retains its value and cities can adapt effectively, as suggested by the Virtuous Boom Loop Arises scenario, they can foster a resurgence of economic activity and urban prosperity.
APPENDIX B
WFH TOOL KIT: HOW OTHER BIG CITIES ARE ADAPTING
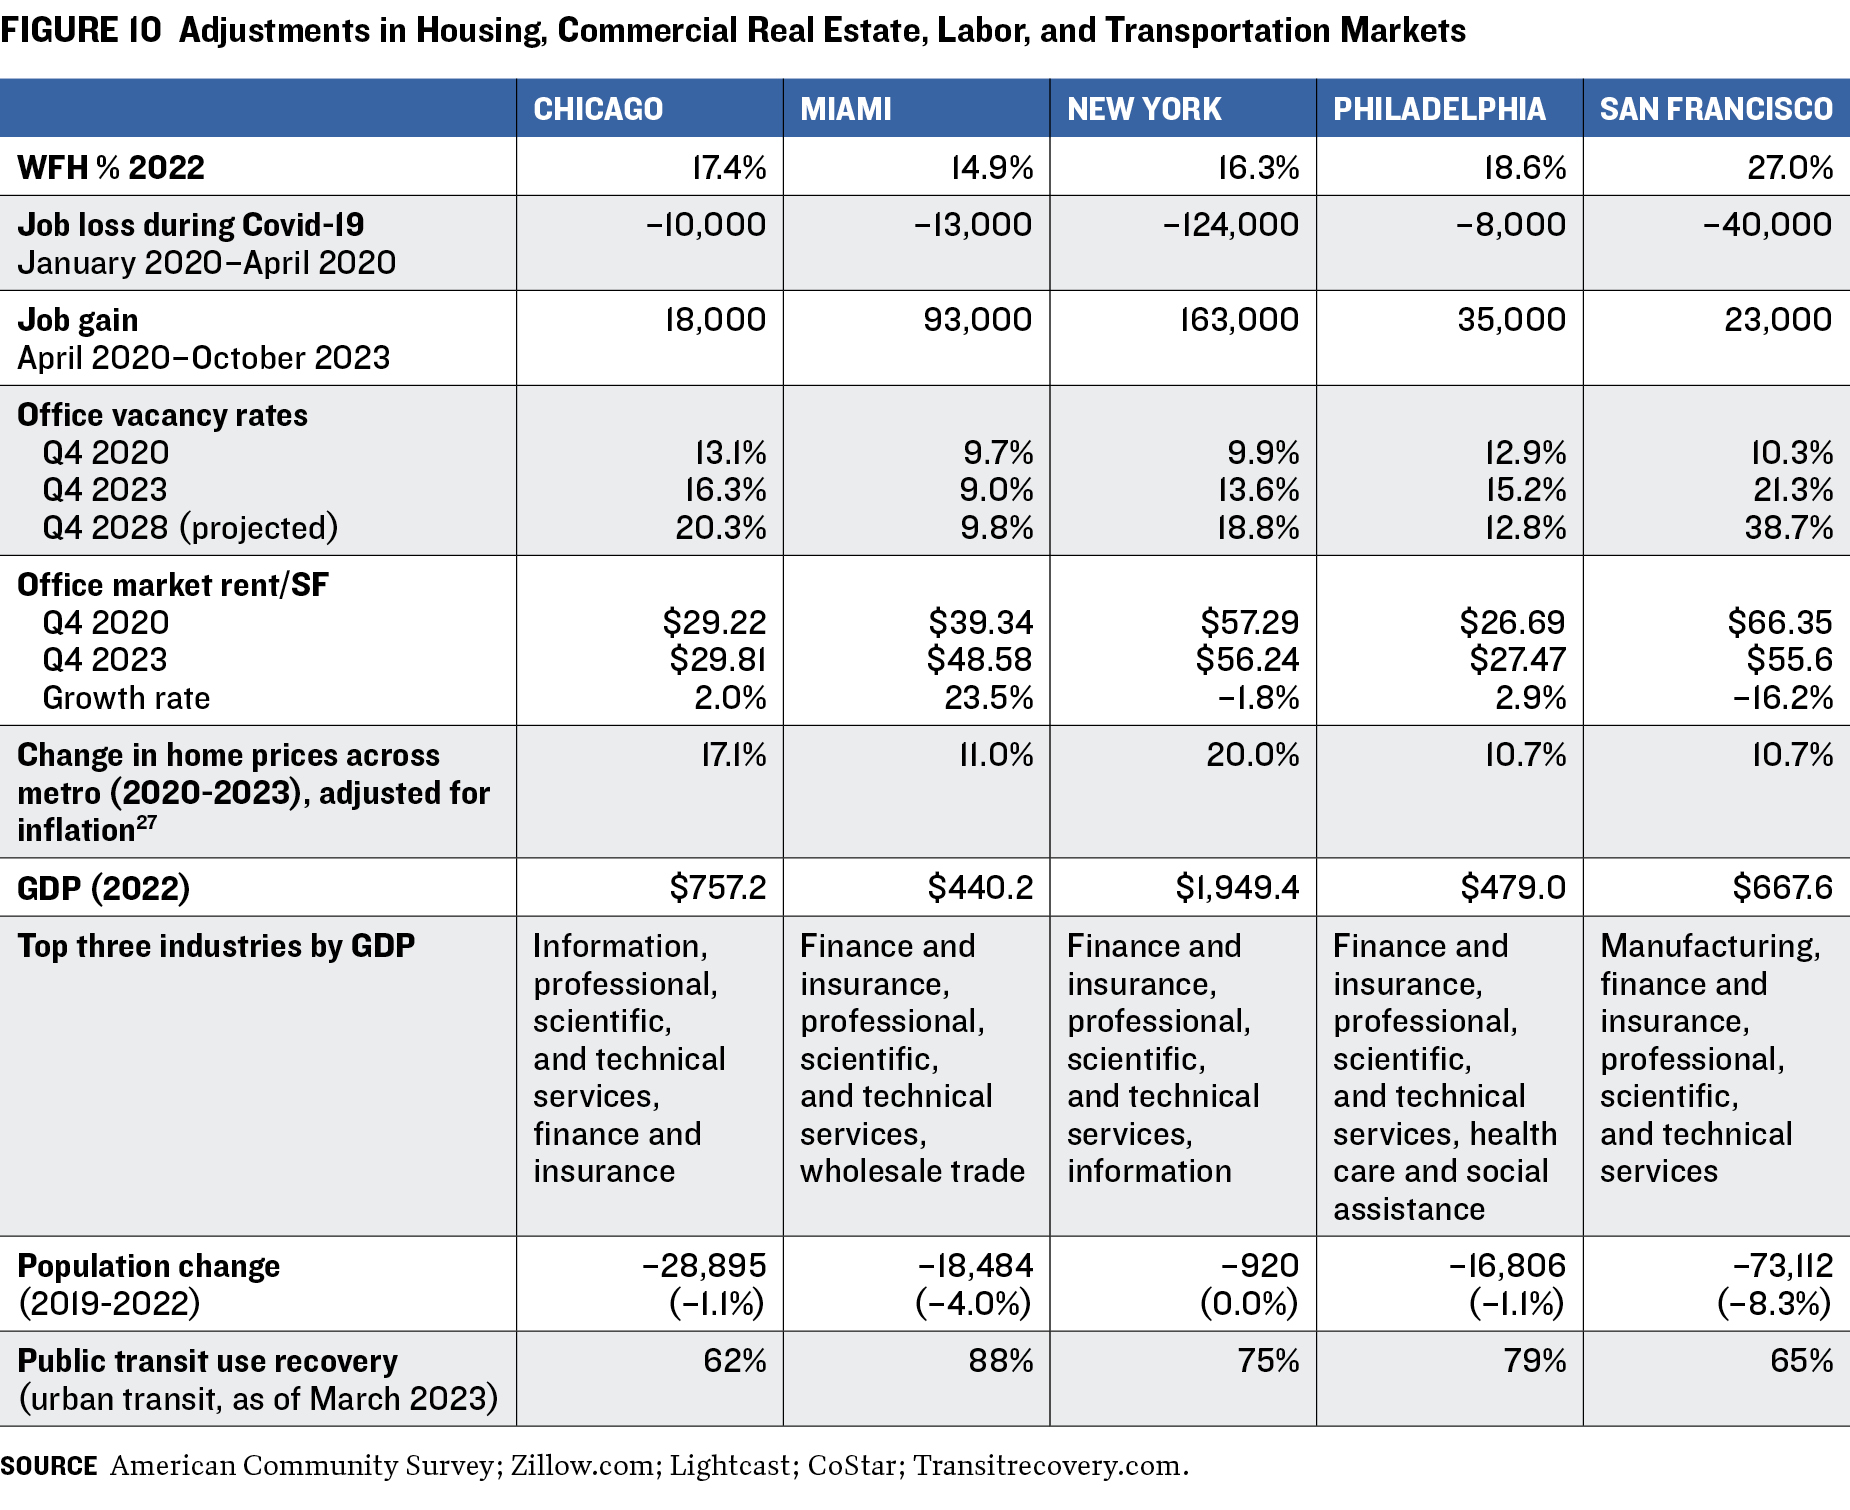
THIS APPENDIX PROVIDES A SHORT SUMMARY of the market adjustments in the other four cities caused by COVID-19. Figure 10 presents key metrics to show adjustments in housing, commercial real estate, labor, and transportation markets in New York and the other four cities studied.
Chicago
Chicago had 4.4 million workers in 2022 and a WFH percentage increase of nearly 12 percentage points, from 5.7 percent in 2019 to 17.4 percent. But its real estate market is anticipated to continue slowing, CoStar reports. The office commercial real estate market in Chicago is not expected to rebound in the near term, which has potential implications for the city’s tax base. “The city’s outyear budgetary flexibility has diminished meaningfully given mounting cost pressures that are not offset by new revenue growth,” S&P Global Ratings commented in February 2024 as the firm lowered its outlook on the city’s general obligation bonds to “stable” from “positive.”28
Entering the third quarter of 2023, the office vacancy rate reached its highest point of the last two decades: 16.3 percent. Move-outs continued to exceed move-ins, resulting in a negative absorption of 5.6 million square feet between November 2022 and October 2023. Meanwhile, the pipelines of new office deliveries and those under construction was at, or lower, than their ten-year supply averages. Amid the glut, asking rents are expected to decrease, with landlords offering tenants generous concessions to secure a leasing contract amid intense competition from a bloated sublet market and distressed properties purchased at reduced prices. But as is the case with New York, multifamily housing demand in Chicago has a stable and positive outlook into the near future. As of January 2024, the vacancy rate for the multifamily housing market was 5.6 percent, and about 7,200 units were additionally occupied over the preceding twelve months29—well over the region’s all-time annual net absorption average of 4,200 units.
Miami
Since the onset of the pandemic, Miami’s WFH percentage nearly doubled—from 6.3 percent in 2019 to 14.9 percent in 2022. The population of downtown Miami has dropped in recent years—a trend contrary to increases in surrounding suburbs. The WFH movement led to office vacancies in central areas as businesses downsized or adopted hybrid work models. This trend also led to increased demand for residential real estate in suburban and outlying areas.
Miami’s labor market supported approximately 3 million employees and an annual gross domestic product of $440.2 billion as of 2022. The Miami metro area gained the highest number of private sector jobs among Florida metro areas in the year ended October 2023.30 In that period, it added 38,600 private sector positions, marking a 3.4 percent increase. The unemployment rate in the Miami metro area was 1.6 percent in October 2023, down 0.8 percentage point from 2.4 percent a year earlier.
Despite the rise in WFH, Miami is one of the few US office markets to witness healthy postpandemic demand due to sustained levels of robust immigration, proximity to a skilled workforce, and a probusiness atmosphere. The region continues to attract new business with average office asking rents 60 percent below those of New York and San Francisco, along with a low corporate income tax and no personal income tax.31 These factors remain appealing to people and firms moving from higher-cost states such as New York and California. As of 2023, office rents in Miami were rising at a 5 percent annual rate, well above national gains of 0.7 percent. But despite continued rent growth, a slowing economic environment—particularly for the finance and tech industries—is resulting in a near-term slowdown in gains from peaks of 10.6 percent in the second half of 2022.
Miami’s rent growth is expected to keep slowing amid a rise in inventory. Despite this, the market’s heightened attractiveness, coupled with the limited availability of high-quality space, should result in continued outperformance in rent gains against the national average. This relative strength in fundamentals is expected to help buoy office market values across South Florida, with Miami representing just a handful of markets with forecast office value gains through 2024 relative to 2019 levels.
Miami office values are expected to rise over 10 percent from prepandemic levels, compared with an average decline of more than 10 percent for the 54 largest US markets. Although office values should outperform relative to 2019 levels, higher interest rates have resulted in an expansion of average annual transaction capitalization rates (defined as a property’s net operating income divided by its asset value) from lows around 5 percent in 2022 to the mid-6 percent range in 2023. This has led to a near-term pricing correction relative to peak pricing levels in 2022. Transaction activity has also cooled, with volume totaling $859 million over the twelve months ended in November 2023, down from $2.5 billion through the second quarter of 2022.32 Despite this slowdown, institutional players remain active and make up 26 percent of market volume over the same period.
In the fiscal 2024 budget, Miami’s property tax was the main source of general fund revenue (50.8 percent), followed by charges for services (12.7 percent), and franchise fees and other taxes (12.6 percent).33 As the economy expanded, the city’s property tax rate had been cut to the lowest in 59 years. The move followed a $39.14 million increase in property tax revenues from fiscal 2022, with property tax rolls growing 14.5 percent amid new construction.34
Philadelphia
The Philadelphia metro area has experienced a tripling in the percentage of people working from home—from 5.7 percent in 2019 to 17.4 percent in 2022. While the sixth-largest city in the US shows signs of a strong recovery in the downtown area, a relatively weak office market predating the pandemic and the fiscal strain of COVID-19 elevate the significance of the potential impacts of WFH trends.
The city’s labor market is one of the ten largest in the nation, supporting 3.1 million employees and an annual GDP of $479 million. The population fell a slight 1 percent between 2019 and 2022, but the housing market has remained strong: Home values rose by 11 percent between 2020 and 2023 after adjusting for inflation.
Similarly, Philadelphia’s downtown has had a vigorous recovery from COVID-19.35 Between April and June 2023, daily foot traffic in Center City (downtown Philadelphia) reached 84 percent of 2019 prepandemic levels. According to Center City District, a business improvement district created in 1991, about 30 percent of people who work downtown Philadelphia live within two miles of their workplace—the highest rate in the nation. The robust population of residents and workers in Center City played a crucial role in its rebound. About 84 percent of these workers have returned to their offices.
Additionally, public transit ridership for urban lines had recovered to 79 percent of prepandemic levels by October 2023; a regional rail ridership recovery was more modest, reaching only 56 percent.36 While public transit costs in Philadelphia are among the most affordable of the cities we studied, the slow comeback of regional rail suggests that people commuting from the suburbs to the city may be using other modes of transportation.
The outlook for Philadelphia’s office market is mixed, as it is both buoyed and hampered by prepandemic trends. The office availability rate remains slightly below the national index of 16.6 percent, largely because largely because it does not have a critical mass of information or technology companies that have embraced WFH. Instead, Philadelphia’s employment base is significantly driven by health care and education, both of which typically require in-person work. In the long term, the city’s office demand growth is expected to remain low, partly because of a city wage tax levied on both city residents and people who work there. A quick and easy recovery is not likely, especially if renewing office tenants continue to shrink their footprint by 20 percent or more. Until interest rates stabilize, businesses will likely continue to delay long-term leasing decisions, stalling any significant momentum in office leasing.
Any long-term effects of WFH would occur in a city already impacted by the costs of the pandemic. Philadelphia has made major reductions in response to the initial financial impact of the COVID-19 shutdown, exhausting a substantial portion of its $290 million cash balance. The city’s spending continues to exceed prepandemic levels, and it has used federal relief funding from the American Rescue Plan Act of 2021 to address budget shortfalls for three years. Over this time, the city has used $976 million of this $1.4 billion funding source. While a short-term solution, this is not a long-term revenue stream.
San Francisco
San Francisco may be one of the cities most impacted by the pandemic and remote work. In 2022, the WFH percentage there was 27 percent—the highest rate among the cities we studied and a 20 percentage points higher than the 2019 level. In 2022, its population fell 6.3 percent, the biggest decline in the past decade.
A report by the offices of the city controller and treasurer, released in July 2023, found that the mass onset of WFH had led to an estimated $484 million shortfall in the city’s tax revenues. If low utilization of downtown offices continues, the municipal tax base may continue to decrease. As of 2023, the cumulative impact of three years of weakened operating performance and eighteen months of elevated interest rates was having a severe effect on the valuation of San Francisco offices. Property owners—particularly those that financed with debt in the past ten years—are seeing substantial reductions in equity value, according to CoStar data. This has led several defaults on office building mortgage loans, and local all-cash buyers are stepping in to acquire properties at deeply discounted prices.
As of 2023, office vacancy in the metro area had increased from about 6 percent in 2019 to 20 percent, while office vacancy in the city’s financial district now exceeds 25 percent. Rents have also fallen in downtown San Francisco, where top-quality, Class A sublease space is available for less than $35 per square foot—about half the asking rate for space rented directly from landlords.
Vacancies are expected to increase over the long term, as tenants with expiring leases adjust their space needs. According to CoStar data, rents are expected to continue moving down with no strong indications of a return to demand growth.
WFH is also reflected in transit ridership. On the Bay Area Rapid Transit District (BART) regional rail system, downtown San Francisco station exits have registered 50,000 or fewer riders per day, down from 100,000 one month before the pandemic.37 Some large Bay Area employers are urging more staff to return to the office, but the general trend is to switch from fully remote to a hybrid work pattern rather than return to the office full time.
ACKNOWLEDGMENTS
THIS REPORT WAS MADE POSSIBLE in part by a grant from the Peter G. Peterson Foundation. The statements made and views expressed are solely the responsibility of the author. We acknowledge the considerable support provided by the late Paul A. Volcker, the Volcker Alliance’s founding chairman, as well as the numerous academics, government officials, and public finance professionals who have guided the Alliance’s research on state budgets for the last seven years. We are also grateful for the longtime support and guidance of the late Richard Ravitch, the former New York State lieutenant governor and founding Alliance board member, who died in June 2023.
ENDNOTES
1. The Doom Loop scenario is taken from Stijn Van Nieuwerburgh, The Remote Work Revolution: Impact on Real Estate Values and the Urban Environment, National Bureau of Economic Research, November 2022, https://www.nber.org/papers/w30662.
2. Includes farm and nonfarm sectors. Hilary Silver, “Working from Home: Before and After the Pandemic,” Contexts, March 2, 2023, 66–70, https://doi.org/10.1177/15365042221142839.
3. Silver, “Working from Home: Before and After the Pandemic.”
4. Katherine Haan, “Remote Work Statistics and Trends in 2023,” Forbes Advisor, June 12, 2023, https://www.forbes.com/advisor/business/remote-work-statistics/.
5. There are two types of agglomeration economies: Localization agglomeration economies resulting from the concentration of an industry in a given place and urban agglomeration economies resulting from the density of economic activity in an area. This paper focuses on the latter. This section is based on research by Kathleen Bolter and Jim Robey, Agglomeration Economies: A Literature Review, W.E. Upjohn Institute for Employment Research, June 30, 2020, https://research.upjohn.org/reports/252/.
6. Rising productivity outside cities as a result of WFH and associated technologies should be reflected in rising wages relative to city wages over time.
7. Jose Maria Barrero, Nicholas Bloom, and Steven J. Davis, The Evolution of Work, National Bureau of Economic Research Working Paper No. 31686, September 2023, https://doi.org/10.3386/w31686.
8. Based on findings in two papers: Ferdinando Monte, Charly Porcher, and Esteban Rossi-Hansberg, Remote Work and City Structure, National Bureau of Economic Research Working Paper No. 31494, July 2023, https://www.nber.org/papers/w31494; and Ferdinando Monte, Charly Porcher, and Esteban Rossi-Hansberg, “Work from Home in Cities: A Tale of Coordination and Multiple Equilibria,” VOX EU, September 7, 2023, https://cepr.org/voxeu/columns/work-home-cities-tale-coordination-and-m…;
9. There is large body of literature measuring the magnitude of agglomeration economies. This section is based on findings in these articles: Richard Voith and Susan Wachter, “The Return of America’s Cities: Economic Rebound and the Future of America’s Urban Centers,” Penn Institute for Urban Research, August 12, 2014, http://penniur.upenn.edu/publications/the-return-of-americas-cities; Patricia C. Melo, Daniel J. Graham, and Robert B. Noland, “A Meta-analysis of Estimates of Urban Agglomeration Economies,” Regional Science and Urban Economics, May 2009, 332–42, https://doi.org/10.1016/j.regsciurbeco.2008.12.002; Pierre-Philippe Combes and Laurent Gobillon, “The Empirics of Agglomeration Economies,” Handbook of Regional and Urban Economics, vol. 5, 247–348 (Amsterdam: Elsevier, 2015).; and Gilles Duranton and Diego Puga, Urban Growth and its Aggregate Implications, National Bureau of Economic Research Working Paper No. 26591, December 2019, https://www.nber.org/system/files/working_papers/w26591/w26591.pdf. Duranton and Puga provide estimates of the elasticity of productivity, as reflected in wages, with respect to scale of employment in an urban area. Urbanization agglomeration, which relate urban scale to productivity, is only one form of agglomeration economy. Localization economies (which relate industry concentration in an urban area to productivity) and consumption agglomerations (which relate opportunities for consumption to density of retail, entertainment, and cultural venues) are others. These agglomerations may all exist together, so focusing only on scale agglomerations is conservative.
10. The benefits of agglomeration must be weighed against the costs of density, which are typically measured as commuting expenses, inclusive of time costs. The cost of commuting is really a result of consumer choices as constrained by individual economic and social circumstances within the broader labor, housing, and transportation markets. For example, the out-of-pocket cost of commuting from a specific community to midtown Manhattan can differ, depending on how one chooses to commute. Driving in a private vehicle and parking in a garage can be many times the cost of taking public transit. Some people live in communities without transit service. Thus, people’s preferences, as constrained by their personal circumstances, can significantly affect the cost of commuting.
11. Duranton and Puga, Urban Growth and Its Aggregate Implications. The authors find that the midterm (eight-year) scale agglomeration elasticity is 0.08, which means that a 10 percent rise in city employment increases productivity (defined as wages) of all workers by little less than 1 percent. While this elasticity is modest, a one percentage point decline in all wages has a relatively large aggregate impact, especially in a city like New York. They also estimate an agglomeration elasticity for the short term of 0.04, which is half the size of the midterm elasticity. This means that when there is a decline in the scale of employment, such as that occurring with WFH, productivity and wages do not fully adjust downward immediately but adjust slowly. Thus, a WFH worker’s wage will adjust downward slowly.
12. Jennifer Roback, “Wages, Rents, and the Quality of Life,” Journal of Political Economy, December 1982, 1257-1275, https://www.jstor.org/stable/1830947. Equilibrium wages depend on productivity, but as pointed out by Roback, equilibrium wages also reflect the industrial structure and cost of living in a region as reflected in house prices and commuting.
13. This loss does not include potential losses associated with reductions in localization agglomeration economies.
14. The New York State Court of Appeals in 2000 struck down as unconstitutional New York City’s commuter tax on out-of-state workers and in-state workers who did not reside in the city. The City of New York, et al., Appellants, v. The State of New York, Respondent, 1 No. 16,
https://www.law.cornell.edu/nyctap/I00_0020.htm, (April 4, 2000).
15. The framework is calibrated to ensure that WFH workers are rationally choosing to work from home, and in equilibrium, lower wages will be offset by commuting cost savings. Otherwise, WFH workers would choose in-person work.
16. To the extent there is a geographic shift in residence, demand for cars (and associated expenses, including public expenses) will increase.
17. Matt Delventhal, Eunjee Kwon and Andrii Parkhomenko, How Do Cities Change When We Work from Home?, December 14, 2020,
https://ssrn.com/abstract=3746549.
18. This section is based on findings in these articles: Jordan Rappaport, “Consumption Amenities and City Population Density,” Regional Science and Urban Economies, November 2008, 533–552, https://doi.org/10.1016/j.regsciurbeco.2008.02.001, and Jan K. Brueckner, Matthew E. Kan, and Gary C. Lin, “A New Spatial Hedonic Equilibrium in the Emerging Work-from-Home Economy?,” American Economic Journal: Applied Economics, April 2023, 285–319, https://doi.org/10.1257/app.20210190.
19. Howard Chernick, David Copeland, and Andrew Reschovsky, “The Fiscal Effects of the COVID-19 Pandemic on Cities: An Initial Assessment,” National Tax Journal, September 2020, 699–732, https://doi.org/10.17310/ntj.2020.3.04.
20. Van Nieuwerburgh, The Remote Work Revolution: Impact on Real Estate Values and the Urban Environment.
21. We adjusted this rate by applying the ratio of the households that are not in the workforce. According to Bureau of Labor Statistics data, as of 2022, of the nation’s 83.8 million families, 80.1 percent had at least one employed member.
22. Arpit Gupta, Vrinda Mittal, and Stijn Van Nieuwerburgh, Work from Home and the Office Real Estate Apocalypse, National Bureau of Economic Research Working Paper 30526, September 2022, https://doi.org/10.3386/w30526.
23. The New York Metropolitan Transportation Council’s Socioeconomic and Demographic (SED) forecasts are produced every four years to meet the requirements under the Metropolitan Transportation Planning regulations. The 2030 forecast can be found at https://www.nymtc.org/en-us/DATA-AND-MODELING/SED-Forecasts/2030-Foreca….
24. As the pandemic hit, New York City saw an 80 percent decline in hotel revenue, with hotel occupancy dropping to about 7 percent as reported by the Hotel Association of New York City. Air traffic also plummeted, by 97 percent, according to the Port Authority of New York and New Jersey, which oversees the city’s five airports. A recent study completed in February 2023 by the Stanford WFH Research team found that with fewer workers coming into Manhattan, consumer spending had dropped by approximately $12.4 billion annually on prepandemic levels. “Remote Work Is Costing Manhattan More Than $12 Billion a Year,” Bloomberg.com, February 12, 2023, https://www.bloomberg.com/graphics/2023-manhattan-work-from-home/?sref=….
25. A further discussion of the impact of the pandemic and WFH on the residential market can be found in Amy Ellen Schwartz and Susan Wachter, “Covid-19’s Impact on Housing Markets,” Journal of Housing Economics, March 2023, Vol. 59, Part B, https://www.sciencedirect.com/science/article/pii/S1051137722000833.
26. Gupta, Mittal, and Nieuwerburgh, Work from Home and the Office Real Estate Apocalypse.
27. Changes in home prices across metro areas are estimated based on the Zillow home value index.
28. S&P Global Ratings, “Chicago GO Bond Rating Outlook Revised to Stable from Positive on Mounting Cost Pressures; ‘BBB+’ Rating Affirmed,” February 22, 2004, https://disclosure.spglobal.com/ratings/en/regulatory/article/-/view/ty….
29. Multifamily vacancy data sourced from CoStar, as of January 2024.
30. FloridaCommerce, “FloridaCommerce Announces the Miami Area October 2023 Employment Data,” November 17, 2023, https://floridajobs.org/news-center/DEO-Press/2023/11/17/floridacommerc….
31. As of 2023, despite some office supply additions, sizable corporate relocation, and a decrease in the share of remote work had helped cement this relative market tightness. According to the Miami-Dade Beacon Council, an economic development organization, commitments from fifty-seven companies looking to expand or relocate to the county were secured in 2022. These commitments are expected to result in 8,000 new direct and indirect jobs with annual wages averaging $97,000. It is also expected that these new businesses will require over 1 million square feet of commercial space, which will further increase demand for the office market in Miami.
32. Office transaction activity data sourced from CoStar as of November 2023.
33. Fiscal year 2024 Adopted Budget, City of Miami, http://archive.miamigov.com/Budget/.
34. Fiscal year 2024 Adopted Budget, City of Miami.
35. John Paul Titlow, “Center City Has Recovered Faster from the Pandemic than Other Major Cities’ Downtown Areas, Report Finds,” PhillyVoice, October 11, 2023, https://www.phillyvoice.com/center-city-philadelphia-pandemic-recovery-….
36. Southeastern Pennsylvania Transportation Authority, “Open Data,” March 23, 2024, https://wwww.septa.org/open-data/.
37. Bay Area Rapid Transit, “Monthly Ridership Report March and Trailing 12-Months,” https://www.bart.gov/sites/default/files/2024-04/202403%20MRR.pdf.
© 2024 VOLCKER ALLIANCE INC.
Published May, 2024
The Volcker Alliance Inc. hereby grants a worldwide, royalty-free, non-sublicensable, non-exclusive license to download and distribute the Volcker Alliance paper titled Doom Loop or Boom Loop: Work from Home and the Challenges Facing America's Big Cities (the “Paper”) for non-commercial purposes only, provided that the Paper’s copyright notice and this legend are included on all copies.
This paper was published by the Volcker Alliance as part of its Truth and Integrity in Government Finance Initiative. The views expressed in this paper are those of the authors and do not necessarily reflect the position of the Volcker Alliance. Any errors or omissions are the responsibility of the authors.
Don Besom, art director; Michele Arboit, copy editor.


