Raising the BAR for Newly Elected Leaders

In contrast to the political violence shaking Ukraine, Thailand, Venezuela and Turkey, the vibrancy of our American democracy has insured that smooth leadership transitions have taken place over the last two months in more than 200 U.S. cities and states.
Elections bring with them the exciting prospect of change. At the same time, they also bring the danger that newly elected leaders will treat change as a goal in and of itself and toss out the signature successes of their predecessors. Let us hope that the current new crop of elected leaders can resist the temptation to toss out effective practices just because they did not invent them. Instead, let's hope they take the time to review what their predecessors did well, build on what works, and fix what does not. Of course, new mayors and governors inevitably set their own policy priorities, which often means new goals. But they need not build a new implementation apparatus if the existing one works well.
One area of noteworthy policy execution progress over the last decade is government’s use of goals and data to accelerate improvements in government performance and increase accountability to the public. Boston, a city now going through a mayoral transition, is among the better practitioners of this practice. With little fanfare, former Boston Mayor Tom Menino, better known for his connection to the city’s neighborhoods than for his management prowess, built a strong performance management and budgeting system.
Some governors, such as Martin O’Malley in Maryland, and mayors in cities such as Baltimore, Buffalo, and Somerville, Massachusetts call this data-rich management approach Stat. The name is adapted from CompStat (short for computerized statistics), which is what New York City’s Police Department dubbed its still vibrant data-driven crime-reducing management system, launched back in the days when Lotus 1-2-3 was the pathbreaking spreadsheet software and precincts delivered their data weekly to headquarters on a floppy disk. Menino called his system Boston About Results (BAR).
Newly elected Boston Mayor Walsh, I urge you: Embrace BAR, use it, and continue to improve it.
Newly elected and incumbent executives around the country, I urge you: Learn from BAR and the growing experience of federal agencies, states, and cities using goals and measurement to boost outcomes, productivity, and accountability. Adopt BAR, adapt it to your community, and improve it.
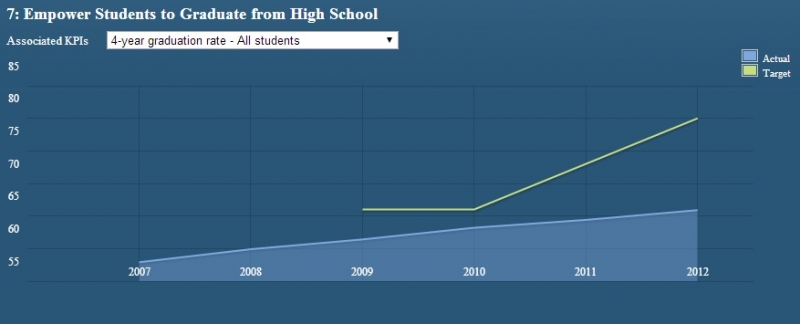
What is Boston About Results? As the City explains, “Boston about Results (BAR) is the City’s performance management program that uses performance measurement and data analytics to develop strategies and programs that evaluate city performance, reduce costs, and ultimately deliver better services to Boston’s residents, businesses, and visitors.” The city uses this tool to monitor and communicate what it is trying to influence: high school graduation rates (trending up), kilowatt reduction from LED street lighting program (trending well), violent crime (going down), property crimes (trending in the wrong direction), and the recycling diversion rate (mixed results.)
BAR Dashboard
Of course, the performance management program does not use measurement and analytics to set goals, decide what to measure, choose strategies, and manage progress. City leaders -- the Mayor working with the Police Chief, Fire Chief, School Superintendent, and department heads-- do that. City leaders who do it best don’t just look at the data and analytics to choose goals and strategies. They engage their employees, delivery partners, and the community in discussing the data to understand what it says and use those insights to inform decision-making.
According to the City, BAR seeks to answer three core questions:
- What is city government doing?
- How well are we doing it?
- Can we do it better?
BAR tells the public the priorities the city has chosen (see FY14 Priority Goals). But BAR does more than report to the public. It also reminds the workforce that the city wants to use a disciplined data-informed approach to tackle its challenges. Quarterly updates reinforce the message that agencies should use data to find what’s working and what’s not, a message that gets reinforced when governors and mayors ask about progress on selected goals each quarter.
How do I like BAR? Let me count some ways.
1) Easy to see trends for indicators that the city is managing and monitoring
2) Lists strategies being used to tackle problems

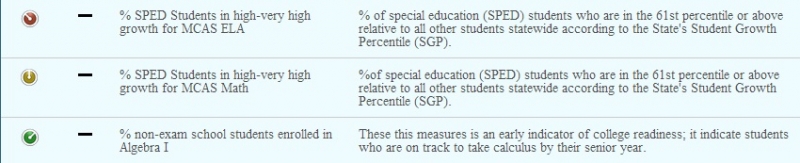
3) Clearly flags areas needing attention without sensationalizing issues
4) Brings spending into the picture in the context of performance objectives
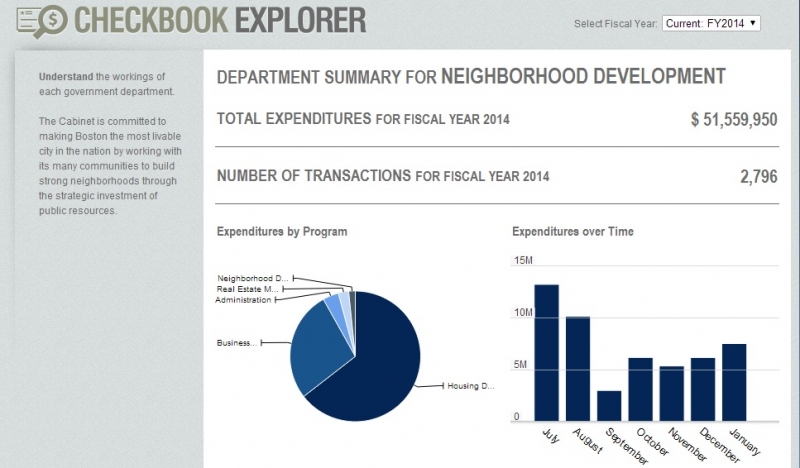
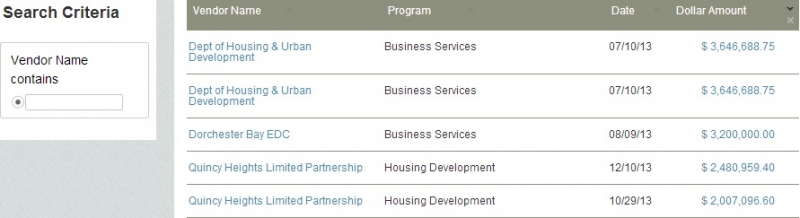
5) Makes it easy to sort spending data by program and vendor
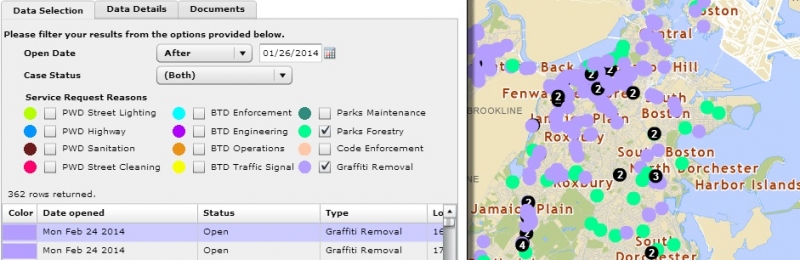
6) Maps citizen service requests and shows status resolving reported problems
Sure, there is plenty of room for improvement. Frankly, I don’t understand the “target” lines on the graphs and find some of the indicators confusing. Seeing the data that goes with the trend lines would help, and in a number of cases, complementing the monthly data with moving average trend lines would more clearly convey the overall direction of change. A bit more narrative description explaining the strategies, trends, and why some variations are happening (e.g., seasonal pattern or a possible problem) would also help. But overall, Boston About Results shows a city striving to do better, and adopting sound performance management practices to do so.
Happily, I see the name of Menino’s successor, Mayor Marty Walsh, already appearing in a few places on the BAR site. I hope that signals his intention to embrace goals, measurement, data-informed decision-making, and transparency as his way of doing business, building on the solid BAR foundation. I hope leaders in other cities and states not already managing this way will, too.

